


 11 August 2016
2016- n° 208In July 2016, prices of frequently purchased goods decreased again slightly in hyper
and supermarkets (−0.1%) Price Index in large and predominantly-food stores - July 2016
11 August 2016
2016- n° 208In July 2016, prices of frequently purchased goods decreased again slightly in hyper
and supermarkets (−0.1%) Price Index in large and predominantly-food stores - July 2016
In July 2016, prices of frequently purchased goods continued to decrease slightly in hyper and supermarkets (-0.1% as in the previous month). They were stable in large and predominantly food stores.
In July 2016, prices of frequently purchased goods continued to decrease slightly in hyper and supermarkets (−0.1% as in the previous month). They were stable in large and predominantly food stores.
Excluding hyper and supermarkets, prices of frequently purchased goods increased again (+0.1%, as in June).
Considering all the kinds of stores, prices of frequently purchased goods were flat over one month, as in the three previous months.
Year-on-year, prices declined again in hyper and supermarkets
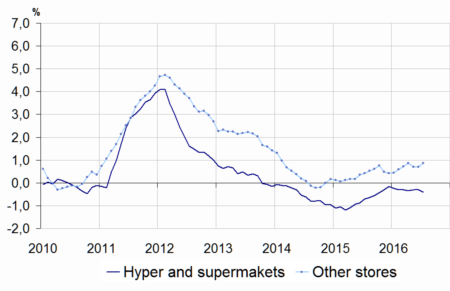
Compared with the same month last year, prices of frequently purchased goods sold in hyper and supermarkets were down again in July (−0.4% after −0.3% in June), as well in hyper and supermarkets as in large and predominantly food stores.
By contrast, prices of frequently purchased goods accelerated in the other kinds of stores (+0.9% year-on-year, after +0.7% in June).
Considering all stores, prices of frequently purchased goods slipped by 0.1% year-on-year for the third month in a row.
graphiqueGraphique1English – Frequently purchased goods price indexes year-on-year change %
- Geographical coverage: metropolitan France
- Source: INSEE - Consumer Price Indexes
graphiqueGraphique2English – Frequently purchased goods price indexes

- Geographical coverage: metropolitan France
- Source: INSEE - Consumer Price Indexes
tableauTableau1English – Prices of frequently purchased goods
| Index | Changes (%) compared to | ||
|---|---|---|---|
| July 2016 | last month (m-o-m) | 12 months before (y-o-y) | |
| Hyper and supermarkets (A) | 99.55 | −0.1 | −0.4 |
| Large and predominantly food stores (A + neighborhood stores) | 99.59 | 0.0 | −0.4 |
| Other stores | 100.79 | 0.1 | 0.9 |
| All stores | 99.85 | 0.0 | −0.1 |
- Geographical coverage: metropolitan France
- Source: INSEE - Consumer Price Indices
tableauTableau2English – Prices of frequently purchased goods detailed by main items
| Index | Changes (%) compared to | ||
|---|---|---|---|
| July 2016 | last month (m-o-m) | 12 months before (y-o-y) | |
| Food and beverages (excluding fresh foodstuffs) | 99.71 | 0.0 | −0.3 |
| - Meat | 100.31 | 0.2 | 0.2 |
| - Beverages | 99.83 | 0.0 | −0.2 |
| - Other food products | 99.34 | −0.2 | −0.5 |
| Clearing and personal care products | 98.77 | −0.1 | −1.1 |
| Total Hyper and supermarkets | 99.55 | −0.1 | −0.4 |
- Geographical coverage: metropolitan France
- Source: INSEE - Consumer Price Indices
Stability in food prices in hyper and supermarkets in July
In July 2016, prices of food excluding fresh foodstuffs sold in hyper and supermarkets were broadly unchanged, after a slight downturn in the previous month (−0.1%). Year-on-year, they fell by 0.3%, after −0.2% in June.
Meat prices picked up in July (+ 0.2%), after a downturn in June (−0.3%). Year-on-year, they grew by 0.2%, as in the previous month. In July 2015, they had been steady over one year.
Prices of beverages sold in hyper and supermarkets were stable for the second month in a row. Year-on-year, they dipped by 0.2%, as in June.
Prices of other food products (excluding fresh food) faltered in July (−0.2%) after two months of stability. Year-on-year, they continued to diminish (−0.5%), at almost the same pace than in the previous eight months (−0.4 %). In July 2015, they had fallen by 1.1% over one year.
Slight decline in prices of cleaning and personal care products in hyper and supermarkets
In July, prices of cleaning and personal care products sold in hyper and supermarkets edged down (−0.1%), after a slight rebound in June (+0.1%). Year-on-year, they declined again (−1.1%), more than in the previous month (−0.9%). In July 2015, their fall was even more pronounced year-on-year (−1.5%).
Pour en savoir plus
