


 28 July 2016
2016- n° 199In June 2016, overall agricultural prices increased by 0.8% over one year Indices of agricultural prices - June 2016
28 July 2016
2016- n° 199In June 2016, overall agricultural prices increased by 0.8% over one year Indices of agricultural prices - June 2016
In June 2016, overall producer prices of agricultural products increased by 0.8% over one year. Excluding fruits and vegetables, they went up by 2.2% over one month and by 0.4% over one year.
In June 2016, overall producer prices of agricultural products increased by 0.8% over one year. Excluding fruits and vegetables, they went up by 2.2% over one month and by 0.4% over one year.
Cereals and oleaginous prices kept on growing
Cereals prices have rebounded for three months, (+9.1%). The exportations were strong, noticeably towards Morocco for wheat. Moreover, the competition from Ukraine and South-America were much weaker as their inventories were being depleted. On the supply side, the heavy rainfalls during the spring lessened the yields and delayed the oncoming harvests in France.
graphiquecereal – Producer prices of cereals

- Source: INSEE
Oleaginous prices have rallied for three months (+6.5%) until June 2016. Rape price increased globally in June despite a downturn in the end of the month due to the return of good weather conditions in the United States and Argentina.
Over one year, jump in potato price, rises in fruits and vegetables prices
Compared to June 2015, potatoes prices surged (+78.8%). The 2015 crop reached its long-term average whereas the previous one was exceptional.
Over one year, fresh fruits prices went up (+8.7%). Apricot and cherry prices climbed resulting from sharply declining productions, as the strong rains reduced the yields. On the other hand, stawberry price decreased : the cold and rainy weather did not encourage their consumptions. Fresh vegetables prices moderatly increased (+3.3% over oen year). Melon and lettuce prices rose: the supply suffered from the weather that spoiled some open-air vegetables. Conversely, tomato price plummeted. Grown in greenhouses - at 98% - its production has been increasing while this month the consumers tended to turn aside from it due to the weather.
graphiquevegetable – Producer prices of fresh vegetables
- Source: SSP (ministry in charge of agriculture)
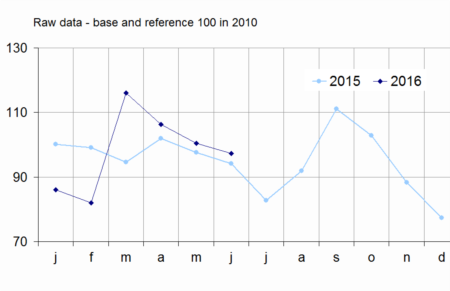
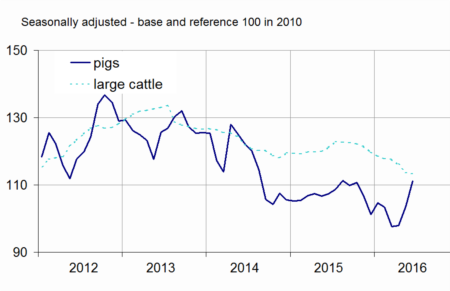
Animals prices rallied
In June, animals prices went up over one month (+1.2 %) after a five month fall. Large cattle prices stepped back over one year (−6,1 %) due to a sluggish demand and the extention of the European livestock since the end of milk quotas. Pig price has firmly picked up since two months (+13.5 % over two months) : the Asian outlet had a significant presence, while the production from North-European showed a slight drop.
graphiquepig – Producer prices of pigs and large cattle
- Source : Insee
Egg price stongly upturned in June following a massive scrap of hens.
tableauTab1 – Indices of producer prices of agricultural products (IPPAP)
| Variation as % over | |||||
|---|---|---|---|---|---|
| Weights | June 2016 | a month | 3 months | a year | |
| Agricultural goods output | 1000 | 113.0 | /// | /// | +0.9 |
| excluding fruits and vegetables | 900 | 113.7 | +2.2 | +3.2 | +0.4 |
| Crop output (excluding fruits and vegetables) | 505 | 119.1 | +2.8 | +5.6 | +3.1 |
| Cereals | 188 | 97.4 | +4.7 | +9.1 | -7.3 |
| of which soft wheat | 112 | 90.8 | +4.6 | +7.6 | -9.4 |
| grain maize | 41 | 103.3 | +6.9 | +17.5 | +9.3 |
| Potatoes | 26 | 225.7 | +7.8 | +22.9 | +78.8 |
| Wines | 177 | 135.2 | +1.0 | +1.3 | +3.7 |
| protected designation of origin | 84 | 145.0 | +2.2 | +1.6 | +7.8 |
| other wines | 23 | 149.2 | -1.1 | +2.9 | -3.4 |
| Oleaginous | 49 | 100.1 | +1.8 | +6.5 | -6.2 |
| Horticultural products | 30 | 110.8 | -0.7 | -2.7 | +2.9 |
| Other crop products | 36 | 108.2 | +0.8 | +0.5 | +1.3 |
| Fruits and vegetables (1) | 100 | 106.5 | /// | /// | +5.0 |
| Fresh vegetables | 53 | 97.3 | /// | /// | +3.3 |
| Fresh fruits | 35 | 117.4 | /// | /// | +8.7 |
| Animal output | 395 | 106.8 | +1.2 | 0.0 | -3.2 |
| Animals | 234 | 110.8 | +1.2 | -0.2 | -2.1 |
| of which large cattle | 96 | 113.3 | -0.4 | -3.7 | -6.1 |
| calves | 26 | 103.7 | -2.3 | -8.9 | +1.5 |
| pigs | 54 | 111.1 | +7.1 | +13.8 | +3.4 |
| sheep | 10 | 109.8 | -0.3 | -6.0 | -5.0 |
| poultry | 46 | 109.5 | -0.1 | -1.0 | -0.5 |
| of which chicken | 28 | 109.4 | 0.0 | -0.6 | -0.5 |
| Milk | 147 | 100.3 | /// | +2.0 | -3.8 |
| of which cow milk (2) | 137 | 99.6 | /// | +2.3 | -4.0 |
| Eggs | 15 | 108.7 | +16.8 | -13.2 | -12.5 |
- * Except for fresh fruits and vegetables
- (1) Including vegetables for industry.
- (2)The May value of cow milk price indice is carried forward in June
- Sources: INSEE, SSP (ministry in charge of agriculture)
Purchase prices of means of production was virtually stable in June
In June, intermediate consumption prices dipped slightly over one month (−0.2 %). The decline in fertilisers prices was nearly offset by the slight rise in energy prices and feed prices. Over one year, those same products became less expensive, thus drove intermediate consumption prices downwards (−2.8%). Capital goods prices were almost stable over one month (-0.1%).
graphiquemeans – Purchase prices of the means of agricultural production
- Sources: INSEE, SSP (ministry in charge of agriculture)
tableauTab2 – Indices of purchase prices of the means of agricultural production (IPAMPA)
| Weights | June 2016 | variation as % over | |||
|---|---|---|---|---|---|
| a month | 3 months | a year | |||
| Total input | 1000 | 107.8 | -0.1 | +0.3 | -2.1 |
| Intermediate consumptions | 764 | 108.1 | -0.2 | +0.2 | -2.8 |
| Energy | 100 | 95.2 | +1.5 | +8.6 | -8.5 |
| Seeds | 57 | 106.5 | -0.1 | -0.2 | -1.6 |
| Fertilisers and soil improvers | 92 | 109.1 | -4.3 | -5.7 | -8.0 |
| Plant protection products | 78 | 100.1 | -0.1 | +0.7 | -0.4 |
| Animal feed | 205 | 112.5 | +0.9 | -0.1 | -4.3 |
| Veterinary expenses | 43 | 117.6 | +0.2 | +0.9 | +3.2 |
| Small equipment and tools | 17 | 107.4 | +0.4 | +0.7 | -0.8 |
| Maintenance of materials | 67 | 113.4 | +0.1 | +0.1 | +0.4 |
| Maintenance of buildings | 9 | 106.8 | 0.0 | +0.2 | -0.2 |
| Other goods and services | 97 | 105.4 | 0.0 | +0.1 | +4.2 |
| Goods and services contributing to investment | 236 | 106.9 | -0.1 | +0.1 | 0.0 |
| Material | 186 | 108.1 | -0.1 | +0.1 | +0.6 |
| Tractors | 79 | 108.3 | +0.2 | +0.3 | +0.9 |
| Machinery and equipment for cultivation | 36 | 110.2 | -0.6 | -0.4 | +1.0 |
| Machinery and equipment for harvesting | 42 | 108.3 | -0.1 | +0.1 | +0.5 |
| Utility vehicles | 18 | 104.4 | +0.3 | +0.2 | -0.3 |
| Buildings | 50 | 102.3 | 0.0 | +0.2 | -2.4 |
- (1) The repayment of the domestic tax on energy product (TICPE) benefiting farmers has been applied in advance for the year 2016
- Sources: INSEE, SSP (ministry in charge of agriculture)
Documentation
Methodology (pdf,122 Ko)
Pour en savoir plus
Time series : Indices of agricultural prices
