


 20 July 2016
2016- n° 186In June 2016, oil prices slowed Prices of oil and raw material imports - June 2016
20 July 2016
2016- n° 186In June 2016, oil prices slowed Prices of oil and raw material imports - June 2016
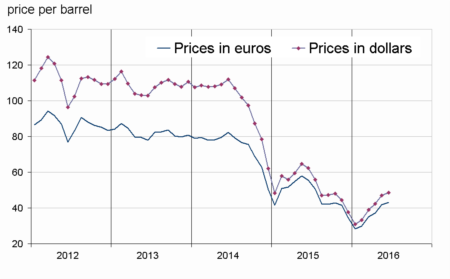
In June 2016, the crude oil price in euros increased less strongly than in May (+3.5% after +11.9%). At €43.2 on average per barrel, the Brent price remained however significantly lower than one year ago (-22.4%).
In June 2016, the crude oil price in euros increased less strongly than in May (+3.5% after +11.9%). At €43.2 on average per barrel, the Brent price remained however significantly lower than one year ago (−22.4%).
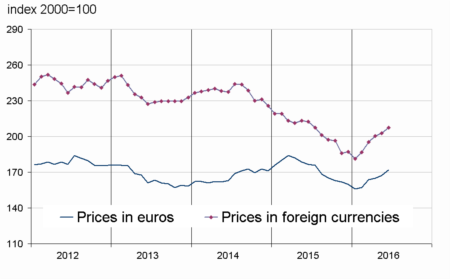
Prices in euros of the other imported commodities grew (+3.0% after +1.3%), driven up by raw food materials prices that rose markedly again (+4.6% after +6.7%). Prices of industrial raw materials revived (+1.8% after −2.1%).
Oil prices increased less strongly than in May
In June, the price of crude oil from the North Sea (Brent) in euros decelerated (+3.5% after +11.9%). In dollars, the price rise was less marked (+2.9% after +11.6%) because the euro depreciated slightly during the month.
tableautabpetrole – Oil and petroleum products
| Prices | Change (%) | |||
|---|---|---|---|---|
| of last month | over the last month | over the last 3 months | over the last 12 months | |
| Brent in $ per barrel | 48.5 | 2.9 | 24.1 | –22.2 |
| Brent in € per barrel | 43.2 | 3.5 | 23.0 | –22.4 |
| Gasoline €/L | 0.35 | –3.2 | 23.3 | –24.9 |
| Gas Oil | 396.0 | 5.5 | 24.0 | –23.4 |
| Heavy fuel | 239.9 | 11.6 | 47.1 | –26.4 |
| Naphtha | 373.9 | 6.9 | 20.9 | –22.7 |
- Prices are in euros per tonne unless otherwise specified
- Source: INSEE
graphiqueG_petrole_ang – Oil (Brent)
- Source: INSEE
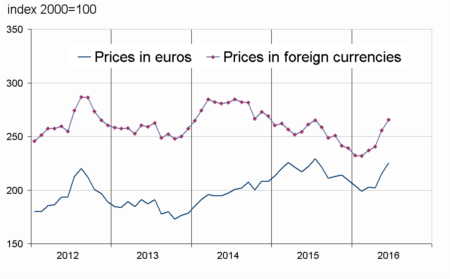
Prices of raw food materials hardly slowed
Prices of raw food materials in euros went up sharply again (+4.6% after +6.7%). The price rise in oil seeds and vegetable oils eased (+5.6% after +12.5%), as a result of plentiful sunflower crops. The price of soybean meal decelerated strongly (+9.3% after +24.3%). Prices of cereals stalled as well (+4.2% after +7.2%), due to a lesser increase in rice price (+2.8% after +9.1%). The price of beef meat continued to reduce (−2.5% after −0.1%). For the second consecutive month, the price of sugar has expanded sharply (+16.6% after +11.6% in May), as a result of heavy rains that halted crops in Brazil. Morerover, high volumes of cane output were allocated to ethanol making.
graphiqueG_alim_ang – Food
- Source: INSEE
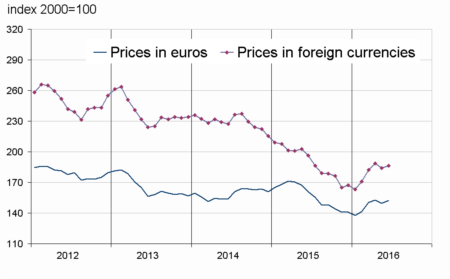
Prices of industrial raw materials picked up
Prices of industrial raw materials in euros recovered (+1.8% after −2.1%). Prices of minerals bounced back (+2.2% after −3.0%). Indeed, prices of non-ferrous metals picked up (+4.0% after −2.1%), driven up by the rebound in lead prices (+5.9% after −5.5%). The recovery in palladium prices (+10.3% after −11.9%) drove up that of precious metals (+3.2% after −0.7%). However, the price of iron ore dropped anew (−5.8% after −7.6%). The rise in agricultural raw materials prices slowed (+0.7% after +1.2%), due to a lesser increase in sawn softwood (+1.3% after +6.7%).
graphiqueG_indus_ang – Industrial raw materials
- Source: INSEE
graphiqueG_ensemble_ang – Imported raw materials (excluding energy)
- Source: INSEE
tableautabmatprem – Imported raw materials (excluding energy) in euros
| Index | Changes (%) | |||
|---|---|---|---|---|
| of last month | over the last month | over the last 3 months | over the last 12 months | |
| Food total | 225.3 | 4.6 | 11.0 | 1.5 |
| Tropical foodstuffs | 211.7 | 5.0 | 4.3 | –3.6 |
| Oil seeds, vegetable oils | 262.2 | 5.6 | 24.6 | 10.2 |
| Cereals | 165.7 | 4.2 | 11.8 | 12.6 |
| Sugar | 192.8 | 16.6 | 24.2 | 64.4 |
| Beef meat | 146.9 | –2.5 | –10.6 | –21.9 |
| Industrial raw materials | 152.3 | 1.8 | 1.3 | –5.3 |
| Agricultural raw materials | 113.6 | 0.7 | 3.1 | –1.8 |
| Natural Fibres | 126.4 | 5.4 | 10.6 | 0.8 |
| Natural rubber | 131.4 | –6.5 | –2.4 | –25.9 |
| Hides | 74.3 | 1.9 | –1.5 | –22.7 |
| Wood pulp | 97.2 | 1.9 | 0.9 | –5.7 |
| Tropical wood | 105.5 | –1.6 | –0.9 | –8.7 |
| Sawn softwood | 102.5 | 1.3 | 8.4 | 9.2 |
| Minerals | 173.6 | 2.2 | 0.8 | –6.5 |
| Iron ore | 338.6 | –5.8 | –8.3 | –17.7 |
| Non-ferrous metals | 146.2 | 4.0 | 2.8 | –5.8 |
| Precious metals | 241.1 | 3.2 | 4.8 | 2.3 |
| All commodities | 172.1 | 3.0 | 5.2 | –2.5 |
- Source: INSEE
Pour en savoir plus
Time series : Raw materials prices
