


 22 September 2016
2016- n° 246In September 2016, the business climate in manufacturing recovers Monthly business survey (goods-producing industries) - September 2016
22 September 2016
2016- n° 246In September 2016, the business climate in manufacturing recovers Monthly business survey (goods-producing industries) - September 2016
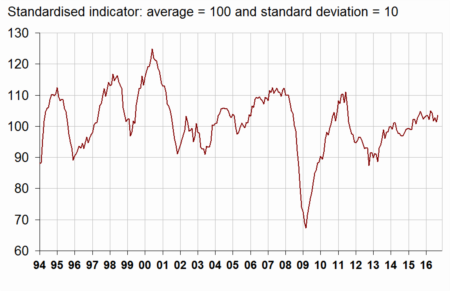
According to the business managers surveyed in September 2016, the business climate in industry has improved. Already above its long-term average (100) since April 2015, the composite indicator has gained 2 points. At 103, it has returned to its July's level.
- Improvement in the opinion on activity
- In the manufacture of food products and beverages, the business climate has bounced back
- The business climate in the manufacture of transport equipment has improved
- In the manufacture of machinery and equipment goods, the business climate is stable at its mean level
- The business climate is just above normal in “other manufacturing”
According to the business managers surveyed in September 2016, the business climate in industry has improved. Already above its long-term average (100) since April 2015, the composite indicator has gained 2 points. At 103, it has returned to its July's level.
graphiqueGraphang1 – Business climate in industry - Composite indicator
The turning-point indicator remains in the zone indicating short-term economic uncertainty.
graphiqueGraphang2 – Turning-point indicator
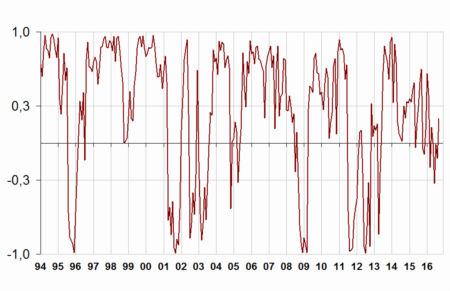
- How to read it: close to 1 (respectively −1), the indicator points to a favourable short-term economic situation (respectively unfavourable). Between −0.3 and +0.3: uncertainty area.
Improvement in the opinion on activity
In September 2016, the balance of opinion on past activity, which remained above normal in August, has increased (+2 points). That on personal production has taken off (+8 points) and has returned above its long-term average.
Business managers in manufacturing are more upbeat than in August on general production prospects in the sector (+6 points). The corresponding balance is above its long-term average since February 2015.
In September, order books have increased overall, even if export ones are virtually stable. The corresponding balances of opinion are above their mean.
Finally, almost as industrialists as in August consider that finished-goods inventories are below normal: the corresponding balance has increased by 1 point but remains below its long-term average.
tableautableau1 – Industrialists' opinion on manufacturing activity
| Manufacturing industry | Ave.* | June 16 | July 16 | Aug. 16 | Sept. 16 |
|---|---|---|---|---|---|
| Composite indicator | 100 | 102 | 103 | 101 | 103 |
| Past activity | 4 | –1 | 10 | 6 | 8 |
| Finished-goods inventory | 13 | 14 | 16 | 9 | 10 |
| Global order books | –18 | –13 | –12 | –16 | –14 |
| Export order books | –14 | –9 | –9 | –9 | –10 |
| Personal production expectations | 5 | 9 | 2 | 2 | 10 |
| General production expectations | –9 | 1 | 2 | 1 | 7 |
- * Long-term average since 1976.
- Source: INSEE - Monthly business tendency survey
The upsurge in the business climate in industry stems from the manufacture of food products and beverages and the manufacture of transport equipment. In other sectors, the business climate is stable.
In the manufacture of food products and beverages, the business climate has bounced back
In the manufacture of food products and beverages, the business climate has increased by 8 points in September. It has practically returned to its July's level, above its long-term average. Almost all of the balances of opinion have contributed to its improvement. Only that on personal production expectations has fallen back.
The business climate in the manufacture of transport equipment has improved
In the manufacture of transport equipment, the business climate has gained 2 points and remains above normal. This improvement is due to the rise in the balances on past and expected activity and that one global order books. It is partly offset by the decline in the balance on export order books and by the upturn in that on finished-goods inventory.
The business climates have recovered both in the manufacture of motor vehicle, trailers and semi trailers and in that of other transport equipment. They were already above their long-term average in August.
In the manufacture of machinery and equipment goods, the business climate is stable at its mean level
In the manufacture of machinery and equipment goods, the business climate has stabilised at its mean level. The balance on past activity has dropped again but those on production expectations and on order books have picked up.
On a sub-sector level, the composite indicator, already below normal, has continued to worsen in electrical equipment (−5 points since July). In the computer, electronic and optical product industry, the business climate is stable at 103, above its mean level. In the machinery and equipment sector, the business climate has improved again (+2 points) and has returned above normal.
The business climate is just above normal in “other manufacturing”
In overall “other manufacturing”, the business climate is stable just above normal. The balances of opinion on past and expected activity have advanced but that on global order books have gone down.
In chemicals and in wood-paper, the business climates have deteriorated and have become slightly inferior to their long-term average. In basic metals, the climate is stable at its mean level. In other sub-sectors, the climates have improved or are virtually stable, above their mean level.
tableautableau2Climats – Business climates in a sector-based approach
| NA* : (A17) et [A38 et A64] | Weights** (%) | July 16 | Aug. 16 | Sept. 16 |
|---|---|---|---|---|
| (C1) Man. of food products and beverages | 21 | 107 | 98 | 106 |
| (C3) Machinery and equipment goods | 11 | 99 | 100 | 100 |
| [CI] Computer, electronic and optical products | 3 | 104 | 103 | 103 |
| [CJ] Electrical equipment | 3 | 98 | 96 | 93 |
| [CK] Machinery and equipment | 5 | 95 | 99 | 101 |
| (C4) Man. of transport equipment | 15 | 105 | 104 | 106 |
| [CL1] Motor vehicles, trailers and semi-trailers | 7 | 106 | 104 | 105 |
| [CL2] Other transport equipment | 8 | 104 | 103 | 104 |
| (C5) Other manufacturing | 46 | 102 | 101 | 101 |
| [CB] Textiles, clothing industries, leather and footwear industry | 2 | 111 | 112 | 111 |
| [CC] Wood, paper, printing | 5 | 103 | 100 | 98 |
| [CE] Chemicals and chemical products | 9 | 100 | 101 | 97 |
| [CG] Rubber and plastic products | 7 | 102 | 100 | 102 |
| [CH] Basic metals and fabricated metal products | 11 | 102 | 100 | 100 |
| [CM] Other manufacturing industries | 9 | 101 | 100 | 103 |
- * NA: aggregated classification, based on the French classification of activities NAF rév.2.
- ** Weights used to aggregate sub-sector's balances of opinion.
- Source: INSEE - Monthly business tendency survey
Documentation
Methodology (pdf,133 Ko)
Pour en savoir plus
Time series : Industry - Activity and demand
