


 9 September 2016
2016In July 2016, manufacturing output decreased slightly (−0.3%) Industrial production index - July 2016
9 September 2016
2016In July 2016, manufacturing output decreased slightly (−0.3%) Industrial production index - July 2016
In July 2016, output decreased slightly in the manufacturing industry (-0.3%), after a sharper fall in June (-1.1%). It declined again in the whole industry (-0.6% after -0.7%).

Please note: all the series are seasonally (SA) and working-day adjusted (WDA).
The commentary shows variations of subsections by decreasing contribution. The contribution of a subsection depends on the extent of the change and on its weight.
In July 2016, output decreased slightly in the manufacturing industry (−0.3%), after a sharper fall in June (−1.1%). It declined again in the whole industry (−0.6% after −0.7%).
Manufacturing output diminished over the past three months (−0.4%)
Over the past three months, output decreased in the manufacturing industry (−0.4% q-o-q). It fell more markedly in the overall industry (−0.7% q-o-q).
Output decreased sharply in mining and quarrying; energy; water supply (−2.4%), in the manufacture of food products and beverages (−1.2%), in the manufacture of machinery and equipment goods (−0.7%) and in that of transport equipment (−0.8%). It tumbled in the manufacture of coke and refined petroleum products (−13.6%). By contrast it was virtually stable in “other manufacturing”.
Over a year, manufacturing output was nearly stable (−0.1%)
Manufacturing output of the past three months of 2016 was virtually stable compared to the same months of 2015 (−0.1%, y-o-y), while overall industrial output faltered (−0.2%).
Over the year, manufacturing output decreased sharply in that of food products and beverages (−2.2%), in that of machinery and equipment goods (−2.2%) and in mining and quarrying; energy; water supply (−1.5%). It plummeted in the manufacture of coke and refined petroleum products (−10.5%). Conversely, it jumped in the manufacture of transport equipment (+5.0%) and rose very slightly in “other manufacturing” (+0.2%).
graphiqueGraphique1a – Monthly Industrial Production Indices
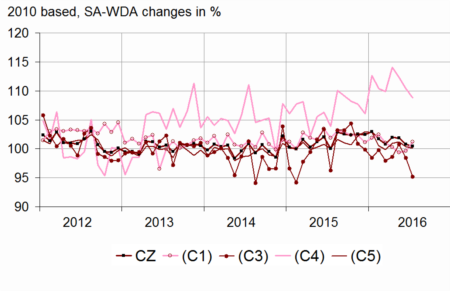
- Legend: CZ: Manufacturing - (C1): Manufacture of food products and beverages - (C3): Machinery and equipment goods - (C4): Manufacture of transport equipment - (C5): Other manufacturing
- Sources: INSEE, SSP, SOeS
tableauTableau1a – Variation of the Industrial Production
| NA : A10, (A17) | July / June | June / May | Q-o-Q change (1) | Year on year change (2) |
|---|---|---|---|---|
| BE: INDUSTRY | –0.6 | –0.7 | –0.7 | –0.2 |
| CZ: Manufacturing | –0.3 | –1.1 | –0.4 | –0.1 |
| (C1): Manufacture of food products and beverages | 1.6 | 0.3 | –1.2 | –2.2 |
| (C2): Manufacture of coke and refined petroleum products | 40.4 | –11.8 | –13.6 | –10.5 |
| (C3): Machinery and equipment goods | –3.3 | –2.3 | –0.7 | –2.2 |
| (C4): Manufacture of transport equipment | –1.4 | –1.7 | –0.8 | 5.0 |
| (C5): Other manufacturing | –0.2 | –0.8 | 0.1 | 0.2 |
| DE: Mining and quarrying; energy; water supply; waste management | –2.5 | 1.4 | –2.4 | –1.5 |
| FZ: CONSTRUCTION | 4.8 | –0.4 | 3.5 | –0.6 |
- (1) Last three months / previous three months
- (2) Last three months / same three months of previous year
- The codes correspond to the level of aggregation A 10 (A 17) of the "NA" aggregated classification based on the French classification of activities NAF rev.2.
- Sources: INSEE, SSP, SOeS
tableauTableau2a – Variation of the Industrial Production
| NA : A10, (A17), [A38 ou A64] | July 2016 | July / June | June / May | Quarter on quarter change |
|---|---|---|---|---|
| BE: INDUSTRY | 99.4 | –0.6 | –0.7 | –0.7 |
| CZ: Manufacturing | 100.5 | –0.3 | –1.1 | –0.4 |
| (C1): Man. of food products and beverages | 101.2 | 1.6 | 0.3 | –1.2 |
| (C2): Man. of coke and refined petroleum products | 88.5 | 40.4 | –11.8 | –13.6 |
| (C3): Machinery and equipment goods | 95.2 | –3.3 | –2.3 | –0.7 |
| [CI] Man. of computer, electronic and optical products | 99.1 | –6.3 | 1.5 | 2.4 |
| [CJ] Man. of electrical equipment | 86.8 | –1.1 | –2.4 | 0.5 |
| [CK] Man. of machinery and equipment n.e.c. (1) | 96.1 | –1.1 | –6.3 | –4.3 |
| (C4): Man. of transport equipment | 108.8 | –1.4 | –1.7 | –0.8 |
| [CL1] Man. of motor vehicles, trailers and semi-trailers | 97.5 | –2.0 | –0.7 | –2.1 |
| [CL2] Man. of other transport equipment | 120.1 | –1.0 | –2.5 | 0.3 |
| (C5): Other manufacturing | 100.2 | –0.2 | –0.8 | 0.1 |
| [CB] Man. of textiles, wearing apparel, leather and related products | 92.1 | 0.1 | –7.2 | –1.0 |
| [CC] Man. of wood and paper products; printing and reproduction of recorded media | 87.4 | 0.5 | 0.0 | 0.6 |
| [CE] Man. of chemicals and chemical products | 113.1 | 3.5 | –1.4 | –3.3 |
| [CF] Man. of basic pharmaceutical products and pharmaceutical preparations | 118.6 | 1.6 | 3.6 | 6.4 |
| [CG] Man. of rubber and plastics products, and other non-metallic mineral products | 95.9 | –1.5 | –0.7 | –0.1 |
| [CH] Man. of basic metals and fabricated metal products, except machinery and equipment | 93.0 | –1.7 | –0.7 | 0.0 |
| [CM] Other manufacturing; repair and installation of machinery and equipment | 100.5 | –1.3 | –2.1 | –0.8 |
| DE: Mining and quarrying; energy; water supply; waste management | 93.1 | –2.5 | 1.4 | –2.4 |
| [BZ] Mining and quarrying | 91.0 | 0.9 | –0.5 | 1.1 |
| [DZ] Electricity, gas, steam and air-conditioning supply | 93.6 | –2.8 | 2.6 | –1.8 |
| [EZ] Water supply; sewerage, waste management and remediation | 89.9 | –2.5 | –6.6 | –8.7 |
| FZ: CONSTRUCTION | 89.7 | 4.8 | –0.4 | 3.5 |
| MIGs (2) | ||||
| Capital goods | 102.0 | –1.1 | –2.7 | –0.7 |
| Intermediate goods | 95.1 | –1.5 | 0.1 | –1.1 |
| Consumer durables | 97.8 | –0.2 | –4.7 | –0.5 |
| Consumer non-durables | 106.0 | 1.5 | 0.4 | 1.2 |
| Energy | 92.7 | –1.2 | 1.0 | –3.2 |
- (1) n.e.c. : not elsewhere classifiable
- (2) Main industrial groupings: definition in Commission regulation EC of 14 June 2007
- Sources: INSEE, SSP, SOeS
In July 2016, output declined again in the manufacture of machinery and equipment goods (−3.3% after −2.3%)
Output dropped back in the manufacture of computer, electronic and optical products (−6.3% after +1.5%). It diminished again in the manufacture of machinery and equipment n.e.c. (−1.1% after −6.3%) and in the manufacture of electrical equipment (−1.1% after −2.4%).
Output fell back in mining and quarrying; energy; water supply; waste management (−2.5% after +1.4%)
Output shrank in electricity, gas, steam and air-conditioning supply (−2.8% after +2.6%), as mild temperatures reduced the use of air-conditioning.
Output continued to decline in the manufacture of transport equipment (−1.4% after −1.7%)
Output dropped again in the manufacture of motor vehicles, trailers and semi-trailers (−2.0% after −0.7%) and in the manufacture of other transport equipment (−1.0% after −2.5%).
Output faltered in “other manufacturing” (−0.2% after −0.8%)
Output decreased sharply in the manufacture of basic metals (−1.7%), in other manufacturing (−1.3%) and in the manufacture of rubber, plastics products, and other non-metallic mineral products (−1.5%). Conversely, it bounced back vigorously in chemicals (+3.5% after −1.4%), and grew again in pharmaceuticals (+1.6% after +3.6%).
Output strengthened in the manufacture of food products and beverages (+1.6% after +0.3%)
Output increased again in the manufacture of food products and beverages, in particular in that of vegetable and animal oils and fats.
Output recovered in the manufacture of coke and refined petroleum products (+40.4% after −11.8%)
Output soared in the manufacture of coke and refined petroleum products, as several refineries returned to full production, after shutdowns in May and June, in particular linked to social movements during this period.
Revisions for June 2016
tableauTableau3a – Revisions of variations
| June / May | May / April | April / March | Q2 2016 / Q1 2016 | 2015 / 2014 | |
|---|---|---|---|---|---|
| Industry (BE) | 0.08 | –0.07 | –0.03 | –0.10 | –0.07 |
| raw serie | 0.23 | –0.03 | –0.02 | 0.03 | –0.06 |
| SA-WDA parameters | –0.15 | –0.04 | –0.01 | –0.13 | –0.01 |
| Manufacturing (CZ) | 0.13 | –0.13 | –0.03 | –0.13 | –0.08 |
| raw serie | 0.26 | –0.03 | –0.03 | 0.05 | –0.07 |
| SA-WDA parameters | –0.13 | –0.10 | 0.00 | –0.18 | –0.01 |
- How to read it: in the manufacturing sector, the SA-WDA variation between May 2016 and June 2016 is revised by +0.13 points, +0.26 points are due to the revision of the raw series and −0.13 points to the updating of the SA-WDA parameters.
- Sources: INSEE, SSP, SOeS
Documentation
Methodology (pdf,163 Ko)
Pour en savoir plus
