


 26 August 2016
2016- n° 222In Q2 2016, French GDP levelled off Quarterly national accounts - second estimate - 2nd quarter 2016
26 August 2016
2016- n° 222In Q2 2016, French GDP levelled off Quarterly national accounts - second estimate - 2nd quarter 2016
In Q2 2016, gross domestic product (GDP) in volume terms* was stable: 0.0% after +0.7% in Q1.
In Q2 2016, gross domestic product (GDP) in volume terms* was stable: 0.0% after +0.7% in Q1.
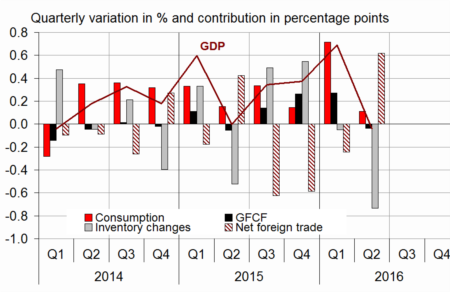
Household consumption expenditure slowed down sharply (0.0% after +1.2%), while total gross fixed capital formation (GFCF) fell back (−0.2% after +1.3%). All in all, final domestic demand (excluding inventory changes) was virtually stable : it contributed to GDP growth for +0.1 points (after +1.0 point in Q1).
Imports slipped dramatically (−2.0% after +0.5%), while exports were almost flat (−0.1% after −0.4%). Thus, foreign trade balance contributed positively to GDP growth (for +0.6 points after −0.2 points). On the contrary, changes in inventories contributed negatively again (for −0.7 points after −0.1 points).
graphiqueGraph1 – GDP and its main components
- Source: INSEE
tableauTab1 – Goods and services:supply and uses chain-linked volumes
| 2015 Q3 | 2015 Q4 | 2016 Q1 | 2016 Q2 | 2015 | 2016 (ovhg) | |
|---|---|---|---|---|---|---|
| GDP | 0.3 | 0.4 | 0.7 | 0.0 | 1.2 | 1.1 |
| Imports | 1.7 | 2.5 | 0.5 | -2.0 | 6.4 | 1.7 |
| Household consumption *expenditure | 0.5 | 0.0 | 1.2 | 0.0 | 1.5 | 1.5 |
| General government's *consumption expenditure | 0.3 | 0.5 | 0.4 | 0.4 | 1.4 | 1.3 |
| GFCF | 0.6 | 1.2 | 1.3 | -0.2 | 0.9 | 2.3 |
| *of which Non-financial corporated and unincorporated enterprises | 0.4 | 1.6 | 2.1 | -0.4 | 2.7 | 3.4 |
| Households | 0.0 | 0.2 | 0.1 | -0.2 | -0.8 | 0.1 |
| General government | 2.7 | 1.4 | 0.1 | 0.7 | -3.9 | 2.1 |
| Exports | -0.3 | 0.7 | -0.4 | -0.1 | 6.0 | 0.4 |
| Contributions : | ||||||
| Internal demand excluding inventory changes | 0.5 | 0.4 | 1.0 | 0.1 | 1.3 | 1.6 |
| Inventory changes | 0.5 | 0.5 | -0.1 | -0.7 | 0.2 | -0.1 |
| Net foreign trade | -0.6 | -0.6 | -0.2 | 0.6 | -0.3 | -0.4 |
- Source: INSEE
Total production declined slightly
In Q2 2016, production in goods and services slightly decreased (−0.1% after +0.7%). Output in the manufactured goods dropped markedly (−0.9% after +0.1%) primarily due to a slump in refinery output, affected by social movements in May and June. Production in construction also fell back (−0.6% after +0.2%). In market services, it was stable (0.0% after +1.1%) and in energy production, it decelerated (+0.8% after +1.1%).
tableauTab3 – Production, consumption and GFCF: main components
| 2015 Q3 | 2015 Q4 | 2016 Q1 | 2016 Q2 | 2015 | 2016 (ovhg) | |
|---|---|---|---|---|---|---|
| Production of branches | 0.4 | 0.6 | 0.7 | -0.1 | 1.3 | 1.2 |
| Goods | 0.3 | 0.5 | 0.2 | -0.5 | 1.2 | 0.2 |
| Manufactured Industry | 0.3 | 0.6 | 0.1 | -0.9 | 1.5 | 0.0 |
| Construction | -0.5 | 0.5 | 0.2 | -0.6 | -2.2 | -0.2 |
| Market services | 0.5 | 0.7 | 1.1 | 0.0 | 1.8 | 1.9 |
| Non-market services | 0.3 | 0.4 | 0.4 | 0.3 | 1.0 | 1.1 |
| Household consumption | 0.5 | 0.0 | 1.2 | 0.0 | 1.5 | 1.5 |
| Food products | -0.1 | 0.3 | 0.4 | -0.7 | 1.2 | 0.3 |
| Energy | 2.1 | -2.5 | 1.7 | 1.7 | 1.4 | 1.5 |
| Engineered goods | 0.7 | 0.1 | 2.3 | 0.1 | 2.6 | 3.0 |
| Services | 0.4 | 0.3 | 0.7 | -0.1 | 1.0 | 1.1 |
| GFCF | 0.6 | 1.2 | 1.3 | -0.2 | 0.9 | 2.3 |
| Manufactured goods | 3.1 | 3.7 | 3.3 | 0.8 | 2.1 | 7.8 |
| Construction | -0.5 | 0.4 | 0.3 | -0.5 | -2.2 | -0.1 |
| Market services | 0.6 | 0.8 | 1.2 | -0.4 | 4.4 | 2.0 |
- Source: INSEE
Household consumption stagnated
In Q2 2016, household consumption expenditure stagnated after a dynamic first quarter (0.0% after +1.2%). Expenditure slowed down both on goods (+0.1% after +1.5%) and services (−0.1% after +0.7%).
Consumption of engineered goods was virtually stable (+0.1% after +2.3%): expenditure on housing equipment kept increasing while car purchases and expenses on textile-clothing fell back. Consumption of food products declined significantly (−0.7% after +0.4%). The downturn in household consumption of services was mainly due to a backlash against ticket sales for the Euro 2016 football championship in Q1 and to a decline in spending on accommodation and food and on transport services. However, energy consumption increased at the same pace than in the previous quarter (+1.7%).

* This growth rate is seasonally and working-day adjusted; volumes are chain-linked previous-year-prices volumes.
Investment expenditure at a standstill
Global GFCF were at a standstill in Q2 (−0.2%), after three consecutive quarters of sharp rise (+1.3% in Q1). Investment decreased in construction (−0.5% after +0.3%), as well as in market services (−0.4% after +1.2%). Expenditure on manufactured goods slowed down notably (+0.8% after +3.3%).
Foreign trade balance contribution to GDP growth was positive
In Q2 2016, exports did not grow (−0.1% after −0.4%) despite a rebound in transport equipment, prompted by deliveries of major contracts in the shipbuilding sector. At the same time, imports declined significantly (−2.0% after +0.5%), particularly in raw hydrocarbons and, to a lesser extent, in refined petroleum products. All in all, foreign trade balance contributed positively to activity in Q2: +0.6 GDP points after −0.2 points.
Changes in inventories contributed again negatively to GDP growth
Changes in inventories contributed negatively to GDP growth again: −0.7 points after −0.1 points. They declined mainly in transport equipment and refined petroleum products.
Revisions
GDP growth stability in Q2 is confirmed. Contributions of GFCF, changes in inventories and foreign trade balance were slightly revised for that quarter.
tableauTab2 – Sectoral accounts
| 2015 Q3 | 2015 Q4 | 2016 Q1 | 2016 Q2 | 2015 | 2016 (ovhg) | |
|---|---|---|---|---|---|---|
| Profit ratio of NFC* (level) | 31.3 | 31.6 | 32.2 | 31.4 | ||
| Household purchasing power | 0.8 | 0.5 | 0.6 | 1.6 | 1.4 |
- *NFC: non-financial corporations
- Source: INSEE
tableauTab4 – Households' disposable income and ratios of households' account
| 2015 Q3 | 2015 Q4 | 2016 Q1 | 2016 Q2 | 2015 | 2016 (ovhg) | |
|---|---|---|---|---|---|---|
| HDI | 0.7 | 0.5 | 0.5 | 1.4 | 1.3 | |
| Household purchasing power | 0.8 | 0.5 | 0.6 | 1.6 | 1.4 | |
| HDI by cu* (purchasing power) | 0.7 | 0.4 | 0.4 | 1.2 | 1.1 | |
| Adjusted HDI (purchasing power) | 0.7 | 0.5 | 0.5 | 1.6 | 1.3 | |
| Saving rate (level) | 14.5 | 14.9 | 14.4 | 14.5 | ||
| Financial saving rate (level) | 5.6 | 5.9 | 5.6 | 5.5 |
- *cu: consumption unit
- Source: INSEE
tableauTab5 – Ratios of non-financial corporations' account
| 2015 Q3 | 2015 Q4 | 2016 Q1 | 2016 Q2 | 2015 | |
|---|---|---|---|---|---|
| Profit share | 31.3 | 31.6 | 32.2 | 31.4 | |
| Investment ratio | 22.8 | 23.0 | 23.2 | 22.9 | |
| Savings ratio | 19.9 | 20.1 | 21.4 | 19.7 | |
| Self-financing ratio | 87.3 | 87.2 | 92.3 | 86.3 |
- Source: INSEE
tableauTab6 – Expenditure, receipts and net borrowing of public administrations
| 2015 Q3 | 2015 Q4 | 2016 Q1 | 2016 Q2 | 2015 | |
|---|---|---|---|---|---|
| In billions of euros | |||||
| Total expenditure | 311.6 | 310.6 | 313.4 | 1243.4 | |
| Total receipts | 291.2 | 294.9 | 294.4 | 1165.9 | |
| Net lending (+) or borrowing (-) | -20.4 | -15.7 | -19.0 | -77.5 | |
| In % of GDP | |||||
| Net lending (+) or borrowing (-) | -3.7 | -2.9 | -3.4 | -3.6 |
- Source: INSEE
Pour en savoir plus
Time series : Operations on goods and services
Time series : Gross domestic product balance
Time series : Institutional sector accounts
Time series : Branch accounts
