


 29 July 2016
2016- n° 200In Q2 2016, French GDP levelled off Quarterly national accounts - first estimate - 2nd quarter 2016
29 July 2016
2016- n° 200In Q2 2016, French GDP levelled off Quarterly national accounts - first estimate - 2nd quarter 2016
In Q2 2016, GDP in volume terms* was stable : 0.0% after +0,7% in Q1.
In Q2 2016, GDP in volume terms* was stable : 0.0% after +0,7% in Q1.
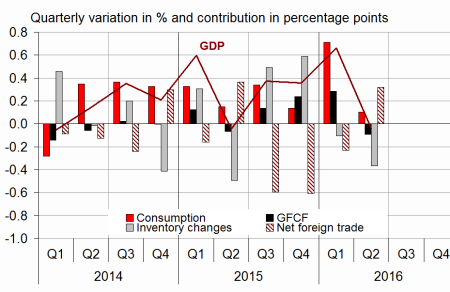
Household consumption expenditure slowed down sharply (0.0% after +1.2%), while total gross fixed capital formation (GFCF) fell back (−0.4% after +1.3%). All in all, final domestic demand (excluding inventory changes) was flat: its contribution to GDP growth was flat (after +1.0 points in Q1).
Imports significantly stepped back (−1.3% after +0.5%), while exports still modestly declined (−0.3% as in the previous quarter). In fine, foreign trade balance contributed positively to activity (+0.3 points after −0.2 points). Conversely, corporate behaviour to inventories contributed anew negatively (−0.4 points after −0.1 points).

* This growth rate is seasonally and working-day adjusted; volumes are chain-linked previous-year-prices volumes.
graphiqueGraph1 – GDP and its main components
- Source: INSEE
tableauTab1 – Goods and services:supply and uses chain-linked volumes
| 2015 Q3 | 2015 Q4 | 2016 Q1 | 2016 Q2 | 2015 | 2016 (ovhg) | |
|---|---|---|---|---|---|---|
| GDP | 0.4 | 0.4 | 0.7 | 0.0 | 1.2 | 1.1 |
| Imports | 1.6 | 2.6 | 0.5 | -1.3 | 6.4 | 2.3 |
| Household consumption *expenditure | 0.5 | 0.0 | 1.2 | 0.0 | 1.5 | 1.5 |
| General government's *consumption expenditure | 0.3 | 0.5 | 0.4 | 0.4 | 1.4 | 1.2 |
| GFCF | 0.6 | 1.1 | 1.3 | -0.4 | 0.9 | 2.1 |
| *of which Non-financial corporated and unincorporated enterprises | 0.4 | 1.5 | 2.1 | -0.2 | 2.7 | 3.5 |
| Households | -0.2 | 0.0 | 0.2 | -0.1 | -0.8 | 0.0 |
| General government | 2.6 | 1.5 | 0.1 | -1.7 | -3.9 | 0.3 |
| Exports | -0.2 | 0.8 | -0.3 | -0.3 | 6.0 | 0.3 |
| Contributions : | ||||||
| Internal demand excluding inventory changes | 0.5 | 0.4 | 1.0 | 0.0 | 1.3 | 1.5 |
| Inventory changes | 0.5 | 0.6 | -0.1 | -0.4 | 0.2 | 0.2 |
| Net foreign trade | -0.6 | -0.6 | -0.2 | 0.3 | -0.3 | -0.7 |
- Source: Insee
Total production slightly declined
In Q2 2016, production in goods and services slightly decreased (−0.2% after +0.7%). Output in manufactured goods sharply dropped (−1.0% after 0.0%) primarily due to a slump in refineries output, affected by social movements in May and June. Production in construction also declined (−0.6% after +0.3%). In market services, it was stable (0.0% after +1.1%) while energy production decelerated (+0.5% after +1.0%).
tableauTab3 – Production, consumption and GFCF: main components
| 2015 Q3 | 2015 Q4 | 2016 Q1 | 2016 Q2 | 2015 | 2016 (ovhg) | |
|---|---|---|---|---|---|---|
| Production of branches | 0.4 | 0.5 | 0.7 | -0.2 | 1.3 | 1.2 |
| Goods | 0.5 | 0.5 | 0.2 | -0.6 | 1.2 | 0.1 |
| Manufactured Industry | 0.5 | 0.7 | 0.0 | -1.0 | 1.5 | -0.1 |
| Construction | -0.6 | 0.4 | 0.3 | -0.6 | -2.2 | -0.2 |
| Market services | 0.6 | 0.6 | 1.1 | 0.0 | 1.8 | 1.9 |
| Non-market services | 0.3 | 0.4 | 0.4 | 0.3 | 1.0 | 1.1 |
| Household consumption | 0.5 | 0.0 | 1.2 | 0.0 | 1.5 | 1.5 |
| Food products | -0.1 | 0.3 | 0.4 | -0.7 | 1.2 | 0.3 |
| Energy | 2.3 | -2.6 | 1.7 | 1.4 | 1.4 | 1.2 |
| Engineered goods | 0.7 | 0.2 | 2.3 | 0.0 | 2.6 | 2.9 |
| Services | 0.4 | 0.3 | 0.7 | -0.1 | 1.0 | 1.1 |
| GFCF | 0.6 | 1.1 | 1.3 | -0.4 | 0.9 | 2.1 |
| Manufactured goods | 3.1 | 3.6 | 3.5 | -0.9 | 2.1 | 6.6 |
| Construction | -0.6 | 0.3 | 0.4 | -0.4 | -2.2 | -0.1 |
| Market services | 0.8 | 0.6 | 1.1 | -0.2 | 4.4 | 2.0 |
- Source: INSEE
Household consumption was flat
In Q2 2016, household consumption expenditure was flat after a dynamic first quarter (0.0% after +1.2%). Expenditure slowed down on goods (0.0% after +1.5%) and on services (−0.1% after +0.7%). Consumption of engineered goods flattened out (0.0% after +2.3%): expenditure on housing equipment kept increasing significantly while car purchases stepped back. Consumption of food products sharply declined (−0.7% after +0.4%). Downturn in household consumption of services was due to repercussion of buying tickets for football Euro 2016 in Q1 and to a decline in spending on accommodation and food. By contrast, energy consumption barely slowed down (+1.4% after +1.7%).
Investment expenditures mark a halt
Global GFCF marked a halt in Q2 (−0.4%), after three consecutive quarters of sharp rise (+1.3% in Q1). Investment in construction decreased (−0.4% after +0.4%), as well as in manufactured goods (−0.9% after +3.5%) and in market services (−0.2% after +1.1%).
Foreign trade balance contribution to GDP growth was positive
In Q2 2016, exports still stepped back slightly (−0.3% as in the previous quarter) despite a rebound in transport equipment. At the same time, imports significantly declined (−1.3% after +0.5%), particularly in manufactured goods and raw hydrocarbons. All in all, foreign trade balance contributed positively to GDP, this quarter: +0.3 points after −0.2 points.
Changes in inventories contributed anew negatively to GDP
Changes in inventories contributed negatively to GDP growth: −0.4 points after −0.1 points. They declined mainly in refined petroleum products and transport equipment.
Revisions
GDP growth estimate in Q1 is slightly upscaled: +0.7% instead of +0.6%. Revisions about different aggregates almost make up for one another; they are mainly due to the revision of indicators.
tableauTab2 – Sectoral accounts
| 2015 Q3 | 2015 Q4 | 2016 Q1 | 2016 Q2 | 2015 | 2016 (ovhg) | |
|---|---|---|---|---|---|---|
| Profit ratio of NFC* (level) | 31.3 | 31.7 | 32.2 | 31.4 | ||
| Household purchasing power | 0.8 | 0.4 | 0.7 | 1.6 | 1.3 |
- *NFC: non-financial corporations
- Source: INSEE
tableauTab4 – Households' disposable income and ratios of households' account
| 2015 Q3 | 2015 Q4 | 2016 Q1 | 2016 Q2 | 2015 | 2016 (ovhg) | |
|---|---|---|---|---|---|---|
| HDI | 0.6 | 0.4 | 0.6 | 1.4 | 1.3 | |
| Household purchasing power | 0.8 | 0.4 | 0.7 | 1.6 | 1.3 | |
| HDI by cu* (purchasing power) | 0.6 | 0.3 | 0.6 | 1.2 | 1.1 | |
| Adjusted HDI (purchasing power) | 0.7 | 0.4 | 0.6 | 1.6 | 1.3 | |
| Saving rate (level) | 14.5 | 14.8 | 14.4 | 14.5 | ||
| Financial saving rate (level) | 5.6 | 5.8 | 5.6 | 5.5 |
- *cu: consumption unit
- Source: INSEE
tableauTab5 – Ratios of non-financial corporations' account
| 2015 Q3 | 2015 Q4 | 2016 Q1 | 2016 Q2 | 2015 | |
|---|---|---|---|---|---|
| Profit share | 31.3 | 31.7 | 32.2 | 31.4 | |
| Investment ratio | 22.8 | 23.0 | 23.2 | 22.9 | |
| Savings ratio | 19.9 | 20.1 | 21.3 | 19.7 | |
| Self-financing ratio | 87.4 | 87.4 | 92.0 | 86.3 |
- Source: INSEE
tableauTab6 – Expenditure, receipts and net borrowing of public administrations
| 2015 Q3 | 2015 Q4 | 2016 Q1 | 2016 Q2 | 2015 | |
|---|---|---|---|---|---|
| In billions of euros | 311.5 | 310.6 | 313.7 | 1243.3 | |
| Total expenditure | 291.3 | 295.2 | 294.4 | 1165.9 | |
| Total receipts | -20.2 | -15.4 | -19.3 | -77.3 | |
| Net lending (+) or borrowing (-) | |||||
| In % of GDP | -3.7 | -2.8 | -3.5 | -3.5 | |
| Net lending (+) or borrowing (-) | 311.5 | 310.6 | 313.7 | 1243.3 |
- Source: INSEE
Pour en savoir plus
