


 13 February 2015
2015- n° 30French GDP increased by 0.1% in Q4. Over the year, GDP rose by 0.4% Quarterly national accounts - second estimate - 4th Quarter 2014
13 February 2015
2015- n° 30French GDP increased by 0.1% in Q4. Over the year, GDP rose by 0.4% Quarterly national accounts - second estimate - 4th Quarter 2014
In Q4 2014, GDP in volume terms increased by 0.1%. Over the year, GDP rose by 0.4% as in 2013.
In Q4 2014, GDP in volume terms increased by 0.1%. Over the year, GDP rose by 0.4% as in 2013.
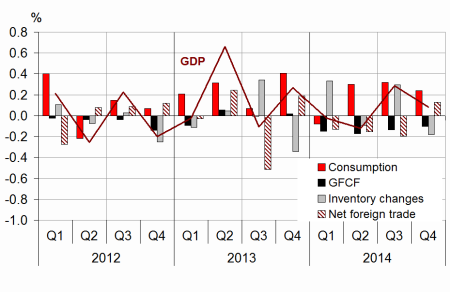
Household consumption expenditure increased slightly by the end of the year (+0.2% after +0.3% in Q3 2014). Conversely, total gross fixed capital formation (GFCF) still decreased (–0.5% after –0.6%). Thus, final domestic demand (excluding inventory changes) rose slightly and contributed for +0.1 points to GDP after +0.2 points in Q3. Exports accelerated markedly in Q4 (+2.3% after +0.7%), while imports kept on increasing (+1.7% after +1.3%). Ultimately, foreign trade balance contributed positively to activity: +0.1 points after –0.2 points. Conversely, changes in inventories contributed for –0.2 points, after +0.3 points the previous quarter.
Total production was flat
In Q4, production in goods and services held steady (after +0.5%). Output in the manufactured goods stepped back (–0.2% after +0.5%), notably production of transport equipment. At the same time, production of tradable services decelerated slightly but still increased (+0.4% after +0.6%) whereas activity in construction dropped again (–1.0% after –1.0%). Over the year, total production increased by 0.6%, after +0.5% in 2013: it renewed with growth in manufacturing industries (+0.4% after –0.6%) and accelerated slightly in tradable services (+1.2% after +0.9%), while the decline in construction intensified (–2.9% after –1.2%).
Investment dropped again
As from the beginning of the year, GFCF continued to decline this quarter (–0.5% after –0.6%). Investment in construction fell again, but less strongly in Q4 (–1.1% after –1.4%). Investment in manufactured goods decreased again (–0.3% after –0.1%).

* This growth rate is seasonally and working-day adjusted; volumes are chain-linked previous-year-prices volumes.
graphiqueGraph1 – GDP and its main components
tableauTab1 – Goods and services:supply and uses chain-linked volumes
| 2014 Q1 | 2014 Q2 | 2014 Q3 | 2014 Q4 | 2013 | 2014 | |
|---|---|---|---|---|---|---|
| GDP | 0.0 | -0.1 | 0.3 | 0.1 | 0.4 | 0.4 |
| Imports | 1.0 | 0.6 | 1.3 | 1.7 | 1.9 | 3.8 |
| Household consumption *expenditure | -0.3 | 0.4 | 0.3 | 0.2 | 0.3 | 0.6 |
| General government *consumption expenditure | 0.3 | 0.4 | 0.6 | 0.4 | 2.0 | 1.9 |
| GFCF | -0.7 | -0.8 | -0.6 | -0.5 | -0.8 | -1.6 |
| *of which Non-financial corporated and unincorporated enterprises | -0.5 | -0.3 | 0.0 | -0.2 | -0.6 | 0.3 |
| Households | -1.7 | -1.6 | -1.5 | -1.5 | -3.1 | -5.8 |
| General government | -0.3 | -1.3 | -1.5 | -0.2 | 1.1 | -2.1 |
| Exports | 0.6 | 0.1 | 0.7 | 2.3 | 2.4 | 2.7 |
| Contributions: | ||||||
| Internal demand excluding inventory changes | -0.2 | 0.1 | 0.2 | 0.1 | 0.4 | 0.4 |
| Inventory changes | 0.3 | -0.1 | 0.3 | -0.2 | -0.2 | 0.3 |
| Net foreign trade | -0.1 | -0.2 | -0.2 | 0.1 | 0.1 | -0.4 |
tableauTab2 – Sectoral accounts
| 2014 Q1 | 2014 Q2 | 2014 Q3 | 2014 Q4 | 2013 | 2014 (ovhg) | |
|---|---|---|---|---|---|---|
| Profit ratio of NFC* (level) | 30.0 | 29.5 | 29.6 | 29.8 | ||
| Household purchasing power | 0.6 | 0.5 | 0.6 | 0.0 | 1.2 |
- *NFC: non-financial corporations
tableauTab3 – Production, Consumption and GFCF: main components
| 2014 Q1 | 2014 Q2 | 2014 Q3 | 2014 Q4 | 2013 | 2014 | |
|---|---|---|---|---|---|---|
| Production of branches | 0.1 | -0.1 | 0.5 | 0.0 | 0.5 | 0.6 |
| Goods | 0.2 | -0.4 | 0.7 | -0.6 | -0.2 | 0.0 |
| Manufactured Industry | 0.7 | -0.8 | 0.5 | -0.2 | -0.6 | 0.4 |
| Construction | -1.3 | -1.3 | -1.0 | -1.0 | -1.2 | -2.9 |
| Market services | 0.2 | 0.1 | 0.6 | 0.4 | 0.9 | 1.2 |
| Non-market services | 0.4 | 0.3 | 0.5 | 0.3 | 1.5 | 1.6 |
| Household consumption | -0.3 | 0.4 | 0.3 | 0.2 | 0.3 | 0.6 |
| Food products | -0.9 | 0.8 | -0.3 | 0.7 | 0.1 | 0.4 |
| Energy | -4.7 | 1.8 | 1.2 | -2.3 | 0.8 | -5.7 |
| Engineered goods | 0.4 | -0.5 | 0.4 | 0.6 | -1.0 | 1.7 |
| Services | 0.1 | 0.2 | 0.2 | 0.3 | 0.6 | 0.7 |
| GFCF | -0.7 | -0.8 | -0.6 | -0.5 | -0.8 | -1.6 |
| Manufactured goods | -0.2 | -0.7 | -0.1 | -0.3 | -0.9 | 0.3 |
| Construction | -1.3 | -1.6 | -1.4 | -1.1 | -1.6 | -3.9 |
| Market services | -0.1 | 0.3 | 0.2 | 0.4 | 0.3 | 0.5 |
tableauTab4 – Households’ disposable income and ratios of households’ account
| 2014 Q1 | 2014 Q2 | 2014 Q3 | 2014 Q4 | 2013 | 2014 (ovhg) | |
|---|---|---|---|---|---|---|
| HDI | 1.1 | 0.5 | 0.5 | 0.6 | 1.6 | |
| Household purchasing power | 0.6 | 0.5 | 0.6 | 0.0 | 1.2 | |
| HDI by cu* (purchasing power) | 0.5 | 0.3 | 0.4 | -0.6 | 0.6 | |
| Adjusted HDI (purchasing power) | 0.6 | 0.5 | 0.6 | 0.5 | 1.3 | |
| Saving rate (level) | 15.4 | 15.5 | 15.8 | 15.1 | 0.0 | |
| Financial saving rate (level) | 6.3 | 6.6 | 6.9 | 5.8 | 0.0 |
- *cu: consumption unit
tableauTab5 – Ratios of non-financial corporations’ account
| 2014 Q1 | 2014 Q2 | 2014 Q3 | 2014 Q4 | 2013 | |
|---|---|---|---|---|---|
| Profit share | 30.0 | 29.5 | 29.6 | 29.8 | |
| Investment ratio | 22.6 | 22.6 | 22.6 | 22.6 | |
| Savings ratio | 17.1 | 17.2 | 17.2 | 17.1 | |
| Self-financing ratio | 75.6 | 75.8 | 76.2 | 75.8 |
tableauTab6 – Expenditure, receipts and net borrowing of public administrations
| 2014 Q1 | 2014 Q2 | 2014 Q3 | 2014 Q4 | 2013 | |
|---|---|---|---|---|---|
| In billions of euros | |||||
| Total expenditure | 307.4 | 308.3 | 310.3 | 1207.7 | |
| Total receipts | 285.8 | 284.7 | 286.3 | 1120.4 | |
| Net lending (+) or borrowing (-) | -21.6 | -23.6 | -24.0 | -87.2 | |
| In % of GDP | |||||
| Net lending (+) or borrowing (-) | -4.0 | -4.4 | -4.5 | -4.1 |
However, investment in tradable services was still growing (+0.4% this quarter after +0.2% in previous quarter). Over the year, GFCF stepped back: –1.6% after –0.8%.
Household consumption decelerated
In Q4 2014, household consumption grew by 0.2%, after +0.3% in Q3. Expenditure in goods decelerated (+0.1% after +0.3%). Total expenditure on energy, in particular gas and electricity, declined sharply (–2.3%) due to temperatures above their seasonal average. Conversely, consumption in food products bounced back (+0.7% after –0.3%) and household expenditure in capital goods were still dynamic (+2.9% after +3.0%). As for services, expenditure accelerated slightly (+0.3% after +0.2%). Over the year, household consumption expenditure accelerated (+0.6% after +0.3%). In 2014, consumption expenditure of general government progressed at a rate close to 2013 (+1.9% after +2.0% in 2013).
Foreign trade balance contributed anew to growth
In Q4, exportations accelerated markedly (+2.3% after +0.7%), especially in transport equipment (+10.7% after –5.0%). In the same time, importations were also more dynamic compared to the previous quarter (+1.7% after +1.3%), mainly due to importations of pharmaceuticals. Overall, the foreign trade balance contributed for +0.1 points this quarter after –0.2 points the previous quarter. Over the year, exportations increased (+2.7% after +2.4%), but less than importations (+3.8% after +1.9%). In 2014, the foreign trade balance weighed down GDP growth (–0.4 points after +0.1 points in 2013).
Changes in inventories weighed down GDP growth at the end of 2014
In Q4, changes in inventories accounted for –0.2 points of GDP growth after +0.3 points. In particular, the negative contribution concerned the transport equipment, in automotive as in aeronautics. Over the year, changes in inventories contributed up to +0.3 points, after –0.2 points in 2013.
Revisions
GDP growth in Q3 2014 is still estimated at +0.3%. Mild revisions are mainly imputable to revisions of indicators and to updates of seasonal adjustment coefficients.
Pour en savoir plus
Time series : Operations on goods and services
Time series : Gross domestic product balance
Time series : Institutional sector accounts
Time series : Branch accounts
