


 30 June 2016
2016- n° 174In April 2016, the sales volume rallied in retail trade but fell again in accommodation
and food service activities and in household services Sales volume in the retail trade and personal services - April 2016
30 June 2016
2016- n° 174In April 2016, the sales volume rallied in retail trade but fell again in accommodation
and food service activities and in household services Sales volume in the retail trade and personal services - April 2016
In April 2016, the sales volume recovered in retail trade, except of motor vehicles and motorcycles (+0.3% after -0.4%) and increased again in trade and repair of motor vehicles and motorcycles (+0.8% after +0.5%). On the contrary, it fell back in accommodation and food service activities (-1.6% after +0.4%) and it decreased again in household services (-2.2 % after -8.5 %).

Every index in this issue is in value (tax excluded), seasonally and working day adjusted (SA-WDA). The commentary shows variations of subsections by decreasing contribution. The contribution of a subsection depends on the extent of the change and on its weight.
In April 2016, the sales volume recovered in retail trade, except of motor vehicles and motorcycles (+0.3% after −0.4%) and increased again in trade and repair of motor vehicles and motorcycles (+0.8% after +0.5%). On the contrary, it fell back in accommodation and food service activities (−1.6% after +0.4%) and it decreased again in household services (−2.2 % after −8.5 %).
graphiqueGraph1_Anglais – Sales volume in the retail trade and personal services
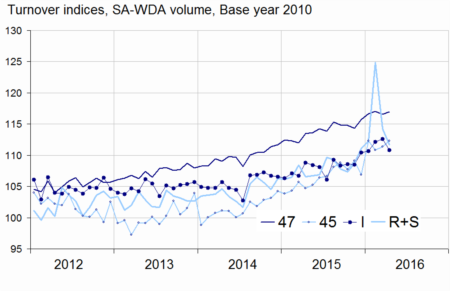
- Source: INSEE
Slight rebound in retail trade
In April 2016, the sales volume recovered slightly in retail trade, except of motor vehicles and motorcycles (+0.3% after −0.4% in March). According to early estimates, it should level off in May 2016.
The sales volume picked up significantly in retail trade not in stores (+6.9% after −1.4%) and slightly in specialised stores (+0.4% after −0.2%) where the increase was concentrated in retail sale of other household equipment (home appliance, furniture, etc. : +1.7%) and in retail sale of cultural and recreation goods (+2.4%). On the other hand, it fell again in non specialised stores (−1.0% after –0.5%).
The sales volume in retail trade, except of motor vehicles and motorcycles increased over the last three months (+1.1%) and year on year (+3.8%).
tableauTab1_anglais – Sales volume in the retail trade and personal services
| Change in % | |||||
|---|---|---|---|---|---|
| NACE Classification | Weight | Apr./ Mar. | Mar./ Feb. | q-o-q (1) | y-o-y (2) |
| 47 Retail trade, except of motor vehicles and motorcycles | 1000 | 0.3 | –0.4 | 1.1 | 3.8 |
| 471 Retail sale in non-specialized stores | 370 | –1.0 | –0.5 | 0.3 | 1.2 |
| 472 to 477 Retail sale in specialized stores | 572 | 0.4 | –0.2 | 1.4 | 5.0 |
| 478 and 479 Retail trade not in stores | 58 | 6.9 | –1.4 | 3.4 | 7.0 |
| 45 Trade and repair of motor vehicles and motorcycles | 1000 | 0.8 | 0.5 | 1.9 | 6.3 |
| I Accommodation and food service activities | 1000 | –1.6 | 0.4 | 1.8 | 4.0 |
| R+S Household services | 1000 | –2.2 | –8.5 | 5.6 | 9.1 |
| R Arts, entertainment and recreation | 422 | –1.7 | –19.1 | 11.7 | 17.8 |
| S Other service activities | 578 | –2.7 | 2.3 | 0.9 | 2.6 |
- (1) Quarter-on-quarter: last three months / previous three months.
- (2) Year-on-year: last three months / same three months of the previous year.
- The codes correspond to different levels of aggregation of the classification NAF rev.2
- Source: INSEE
tableauTabprecoce_anglais – Sales volume in the retail trade: early estimate*
| Change in % | ||
|---|---|---|
| May 2016/ Apr. 2016 | May 2016/ May 2015 | |
| 47 Retail trade, except of motor vehicles and motorcycles | 0.0 | 2.9 |
- * Econometric estimate from a set of sources available within 30 days after the end of the reference month
- Source: INSEE
Further increase in trade and repair of motor vehicles and motorcycles
The sales volume in retail trade and repair of motor vehicles and motorcycles continued to increase in April (+0.8% after +0.5% in March), buoyed again by sale of motor vehicles (+1.4% after +1.0%).
The sales volume of the whole sector grew sharply quarter over the last three months (+1.9%) and year on year (+6.3%).
tableauTab2_anglais – Sales volume in the retail trade and personal services
| Change in % | |||||
|---|---|---|---|---|---|
| Nace Classification | Weight | Apr. 2016 | Apr./ Mar. | Mar./Feb. | q-o-q (1) |
| 47 Retail trade, except of motor vehicles and motorcycles | 1000 | 116.9 | 0.3 | –0.4 | 1.1 |
| 471 Non-specialised stores | 370 | 108.5 | –1.0 | –0.5 | 0.3 |
| 472 to 477 Specialised stores | 572 | 121.4 | 0.4 | –0.2 | 1.4 |
| 472 Retail sale of food, beverages and tobacco in specialised stores | 48 | 130.1 | –0.8 | 0.1 | 2.2 |
| 473 Retail sale of automotive fuel | 77 | 96.3 | –1.3 | –2.7 | –0.5 |
| 474 Retail sale of information and communication equipment | 28 | 180.8 | 1.6 | 0.7 | 1.8 |
| 475 Retail sale of other household equipment | 113 | 108.5 | 1.7 | 0.1 | 3.0 |
| 476 Retail sale of cultural and recreation goods | 48 | 107.3 | 2.4 | –1.8 | 0.8 |
| 477 Retail sale of other goods in specialised stores | 259 | 129.0 | 0.1 | 0.2 | 1.1 |
| 478 et 479 Retail trade not in stores | 58 | 127.2 | 6.9 | –1.4 | 3.4 |
| 45 Wholesale and retail trade and repair of motor vehicles and motorcycles | 1000 | 112.3 | 0.8 | 0.5 | 1.9 |
| 451 Sale of motor vehicles | 671 | 109.3 | 1.4 | 1.0 | 2.6 |
| 452 Maintenance and repair of motor vehicles | 78 | 104.0 | –0.7 | 1.0 | 1.9 |
| 453 Sale of motor vehicle parts and accessories | 227 | 126.6 | 0.0 | –0.2 | 0.2 |
| 454 Sale, maintenance and repair of motorcycles and related parts and accessories | 24 | 88.7 | –1.8 | –7.2 | 3.5 |
| I Accommodation and food service activities | 1000 | 110.8 | –1.6 | 0.4 | 1.8 |
| 55 Accommodation | 239 | 102.7 | –4.8 | 2.1 | 2.4 |
| 56 Food and beverage service activities | 761 | 113.4 | –0.6 | –0.1 | 1.7 |
| 561 Restaurants… | 560 | 113.6 | –0.7 | 0.0 | 1.2 |
| 562 Event catering… | 119 | 106.8 | –0.3 | –1.1 | 3.4 |
| 563 Beverage serving activities | 82 | 121.0 | –0.5 | 0.5 | 2.1 |
| R+S Household services | 1000 | 111.7 | –2.2 | –8.5 | 5.6 |
| R Arts, entertainment and recreation | 422 | 118.0 | –1.7 | –19.1 | 11.7 |
| 90 Creative, arts and entertainment activities | 116 | 103.2 | –5.4 | –4.1 | 2.4 |
| 91 Libraries, archives, museums… | 10 | 124.8 | –9.6 | 7.9 | 1.5 |
| 92 Gambling and betting activities | 106 | 113.2 | –0.6 | –0.8 | –0.5 |
| 93 Sports activities and amusement... | 190 | 129.3 | 0.0 | –31.8 | 23.8 |
| S Other service activities | 578 | 107.1 | –2.7 | 2.3 | 0.9 |
| 95 Repair of computers… | 206 | 91.0 | –7.0 | 7.4 | 2.9 |
| 96 Other personal service activities | 372 | 116.0 | –0.7 | 0.1 | 0.0 |
- (1) Quarter-on-quarter: last three months / previous three months.
- Source: INSEE
Downturn in accommodation and food service activities
The sales volume in accommodation and food service activities fell back in April (−1.6% after +0.9% on average since December 2015). The decrease was more marked in accommodation (−4.8%) than in food and beverage service activities (−0.6%).
The sales volume of the whole sector increased sharply over the last three months (+1.8%) and year on year (+4.0%)
Further fall in household services
In April, the sales volume in household services decreased again (−2.2% after −8.5%). Almost all sectors were down, in particular those of repair of computers (−7.0% after +7.4%) and creative, arts and entertainment activities (−5.4% after −4.1%). The only exception were sports activities and amusement which levelled off after a significant fall in March (−31.8%).
The sales volume in household services rose significantly over the last three months (+5.6%) and year on year (+9.1%).
Revisions
The variation in the sales volume for March 2016 has been raised by 1.5 points in household services, from −10.0% to −8.5%, due to the integration of late declarations from businesses and to the new calculation of SA-WDA coefficients. The change has been lowered by 0.1 points in the retail trade and in accommodation and food services activities. It was unchanged in retail trade and repair of motor vehicles.
In May, turnover fell back in large-scale food retailing
In May 2016, the turnover in large-scale food retailing slipped back (−1.1% after +0.4% in April). Sales of food products shrank strongly (−2.8% after +1.2%) and those of non-food products slightly (−0.4% after +0.7%). However, sales of automotive fuel increased significantly (+4.2% after a stability in March).
tableauTab3_anglais – Monthly turnover indices in large-scale food retailing
| Change in % | ||||
|---|---|---|---|---|
| May 2016/ Apr. 2016 | Apr. 2016/ Mar. 2016 | q-o-q (1) | y-o-y (1) | |
| Turnover | –1.1 | 0.4 | –0.6 | –1.0 |
| Including | ||||
| Sales of food products | –2.8 | 1.2 | –1.3 | 0.1 |
| Sales of non-food products | –0.4 | 0.7 | 2.3 | –0.9 |
| Sales of automotive fuel | 4.2 | 0.0 | 1.7 | –7.5 |
- (1) Quarter-on-quarter: last three months / previous three months.
- Source: INSEE - Monthly survey on large scale food retailing (Emagsa)
Documentation
Methodology (pdf,121 Ko)
Pour en savoir plus
