


 23 June 2016
2016- n° 161In June 2016, the business climate in manufacturing has worsened but remains above
normal Monthly business survey (goods-producing industries) - June 2016
23 June 2016
2016- n° 161In June 2016, the business climate in manufacturing has worsened but remains above
normal Monthly business survey (goods-producing industries) - June 2016
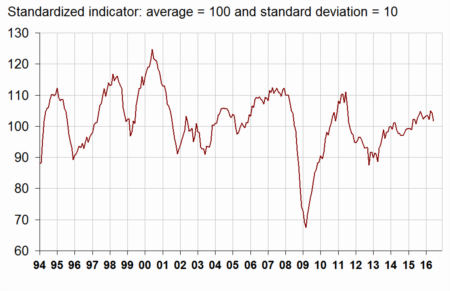
According to the business managers surveyed in June 2016, the business climate in industry is less favourable. The composite indicator has lost 2 points. However, at 102, it remains above its long-term average (100).
- Deterioration of the opinion on past activity
- In the manufacture of food products and beverages, the business climate has improved
- In the manufacture of machinery and equipment goods, the business climate has slightly decreased again
- The business climate in the manufacture of transport equipment is stable and considerably above its mean
- The business climate is less favourable in “other manufacturing”
According to the business managers surveyed in June 2016, the business climate in industry is less favourable. The composite indicator has lost 2 points. However, at 102, it remains above its long-term average (100).
graphiqueGraphang1 – Business climate in industry - Composite indicator
The turning-point indicator is now in the zone indicating an unfavourable economic outlook.
graphiqueGraphang2 – Turning-point indicator
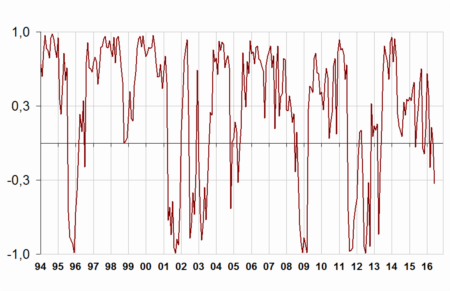
- How to read it: close to 1 (respectively −1), the indicator points to a favourable short-term economic situation (respectively unfavourable). Between −0.3 and +0.3: uncertainty area.
Deterioration of the opinion on past activity
In June 2016, the balance of opinion on past activity has slumped (−14 points) and has become inferior to its long-term average. However, that on personal production, already above its average since December 2015, has slightly increased (+2 points) and has returned to its April's level.
Business managers in manufacturing are less optimistic than in April on general production prospects in the sector (−4 points). However, the corresponding balance remains above its long-term average, as has been the case since February 2015.
In June, global order books are virtually stable. Export order books have slightly deteriorated again. The corresponding balances are above their mean.
Finally, more industrialists than in May consider that finished-goods inventories are above normal: the corresponding balance has increased since March and has become slightly superior to its long-term average.
tableautableau1 – Industrialists' opinion on manufacturing activity
| Manufacturing industry | Ave.* | March 16 | April 16 | May 16 | June 16 |
|---|---|---|---|---|---|
| Composite indicator | 100 | 102 | 105 | 104 | 102 |
| Past activity | 4 | –6 | 10 | 13 | –1 |
| Finished-goods inventory | 13 | 6 | 9 | 11 | 14 |
| Global order books | –18 | –14 | –10 | –13 | –14 |
| Export order books | –15 | –8 | –5 | –8 | –10 |
| Personal production expectations | 5 | 15 | 9 | 7 | 9 |
| General production expectations | –9 | –2 | –1 | 5 | 1 |
- * Long-term average since 1976.
- Source: INSEE - Monthly business tendency survey

Warning: from now on, new sub-sector business climate indicators are published (see the methodological note). All the sub-sector balances of opinion, which appeared so far in this publication, remain available in the long series file and in the INSEE macro-economic database, BDM.
The weakening of the business climate in the industry stems mainly from the “other manufacturing” sector and the manufacture of machinery and equipment goods. However, the business climate has improved in the manufacture of food products and beverages.
In the manufacture of food products and beverages, the business climate has improved
In the manufacture of food products and beverages, the business climate has increased by 2 points in June. Its level (106) is significantly above its long-term average it has exceeded since April 2016. Its improvement is mainly due to the balances of opinion on expected activity and on order books.
In the manufacture of machinery and equipment goods, the business climate has slightly decreased again
In the manufacture of machinery and equipment goods, the business climate fell below its long-term average in May and has slightly decreased again in June (−4 points since April). That comes from the balances on past activity and on production prospects.
On a sub-sector level, the composite indicator has continued to deteriorate in electrical equipment (−7 points since April) and has reached a level (93) significantly below its mean. In computer, electronic and optical product industry, the business climate is virtually stable (107 in June) above its mean level. In the machinery and equipment sector, it is stable (97) under its mean.
The business climate in the manufacture of transport equipment is stable and considerably above its mean
In the manufacture of transport equipment, the business climate is stable at 106, considerably above its long-term average. On the one hand, the balances on global order books and on past activity have increased; on the other hand, the balance on production prospects has plummeted and has become slightly inferior to normal.
In the manufacture of motor vehicle, trailers and semi trailers, as in the manufacture of other transport equipment, the business climates are virtually stable above their long-term average.
The business climate is less favourable in “other manufacturing”
In overall “other manufacturing”, the business climate has lost 3 points. At 101, it remains slightly above its mean. This decrease stems from the decline of balances of opinion on order books and on past activity, partly offset by the rise of that on production prospects.
The business climates have plunged in chemicals and in “other manufacturing industries”, where they have become inferior to their long-term average. In plastics industries, it has decreased and has returned to its April's level, above normal. Conversely, it has improved in wood, paper and printing. It is virtually stable above its mean in basic metals and in the textiles and clothing industry.
tableautableau2Climats – Business climates in a sector-based approach
| NA* : (A17) et [A38 et A64] | Weights** (%) | April 16 | May 16 | June 16 |
|---|---|---|---|---|
| (C1) Man. of food products and beverages | 21 | 104 | 104 | 106 |
| (C3) Machinery and equipment goods | 11 | 102 | 99 | 98 |
| [CI] Computer, electronic and optical products | 3 | 108 | 106 | 107 |
| [CJ] Electrical equipment | 3 | 100 | 95 | 93 |
| [CK] Machinery and equipment | 5 | 98 | 97 | 97 |
| (C4) Man. of transport equipment | 15 | 110 | 106 | 106 |
| [CL1] Motor vehicles, trailers and semi-trailers | 7 | 112 | 107 | 106 |
| [CL2] Other transport equipment | 8 | 104 | 104 | 103 |
| (C5) Other manufacturing | 46 | 102 | 104 | 101 |
| [CB] Textiles, clothing industries, leather and footwear industry | 2 | 108 | 107 | 108 |
| [CC] Wood, paper, printing | 5 | 102 | 100 | 104 |
| [CE] Chemicals and chemical products | 9 | 101 | 103 | 97 |
| [CG] Rubber and plastic products | 7 | 103 | 106 | 103 |
| [CH] Basic metals and fabricated metal products | 11 | 101 | 102 | 102 |
| [CM] Other manufacturing industries | 9 | 98 | 104 | 97 |
- * NA: aggregated classification, based on the French classification of activities NAF rév.2.
- ** Weights used to aggregate sub-sector's balances of opinion.
- Source: INSEE - Monthly business tendency survey
Documentation
Methodology (pdf,133 Ko)
Pour en savoir plus
Time series : Industry - Activity and demand
