


 17 June 2016
2016- n° 155In Q1 2016, the labour cost index - wages and salaries increased by 0.6% and the labour
cost index - total labour cost increased by 1.2% Labor cost index in industry, construction and services - 1st Quarter 2016
17 June 2016
2016- n° 155In Q1 2016, the labour cost index - wages and salaries increased by 0.6% and the labour
cost index - total labour cost increased by 1.2% Labor cost index in industry, construction and services - 1st Quarter 2016
In the first quarter of 2016, the labour cost index (LCI) - wages & salaries in the non-agricultural market sector increased almost at the same pace than in the previous quarter: +0.6% after +0.5% quarter-on-quarter, in seasonally adjusted data. Year-on-year, it rose by +1.6% as in Q4 2015. Average working hours increased slightly (+0.1% in y-o-y after being stable in Q4 2015).

Warnings:
- Seasonal adjustment method has been improved moreover, indices released here are now working-day adjusted.
- Since 1st January 2016, employers have to offer a complementary health insurance to their employees, paying half contribution at least. The measure effect is estimated at +0.5 points on average on the whole LCI – total labour cost for Q1 2016.
- Since 1st January 2016, the rate of the tax credit for encouraging competitiveness and jobs (CICE) has increased from 7.5% to 9.0% in overseas departments only.
The labour cost index - wages & salaries increased by 0.6%
In the first quarter of 2016, the labour cost index (LCI) - wages & salaries in the non-agricultural market sector increased almost at the same pace than in the previous quarter: +0.6% after +0.5% quarter-on-quarter, in seasonally adjusted data. Year-on-year, it rose by +1.6% as in Q4 2015. Average working hours increased slightly (+0.1% in y-o-y after being stable in Q4 2015).
graphiqueGraphSSangl – LCI - wages and salaries: year-on-year changes
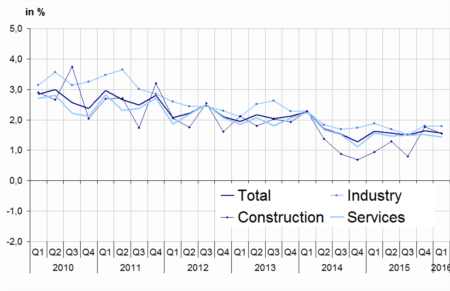
- Scope: non-agricultural market sector excluding household services Sources: Acoss, Dares, Insee
Wages slowed down in construction
In Q1 2016, wages in industrial activities rose at almost the same pace than in the previous quarter (+0.5% q-o-q after +0.6% in Q4 2015). Year-on-year, the increase was stable (+1.8%, as in Q4 2015).
In construction, wages slowed down: +0.4% q-o-q after 1.0% in Q4 2015. Year-on-year, wages decelerated slightly (+1.6% after +1.8%).
Wages accelerated in services
In services, wages sped up in the beginning of 2016 (+0.6% q-o-q after +0.3% in Q4 2015). Nevertheless, year-on-year, wages rose at about the same pace than in the previous quarter (+1.4% after +1.5%).
tableautableauSSangl – LCI - wages & salaries
| Quarterly variations (%) | Annual variations (%) | |||
|---|---|---|---|---|
| Q4-15 | Q1-16 | Q4-15 | Q1-16 | |
| Industry | 0.6 | 0.5 | 1.8 | 1.8 |
| Mining and quarrying | 0.3 | 0.2 | 0.8 | 0.6 |
| Manufacturing | 0.7 | 0.6 | 1.8 | 1.9 |
| Electricity, gas, steam and air conditioning supply | 0.1 | 0.0 | 1.6 | 1.2 |
| Water supply; sewerage, waste management and remediation activities | 0.3 | 0.2 | 1.4 | 0.9 |
| Services | 0.3 | 0.6 | 1.5 | 1.4 |
| Wholesale and retail trade; repair of motor vehicles and motorcycles | 0.3 | 0.4 | 1.5 | 1.5 |
| Transportation and storage | 0.2 | 0.4 | 1.0 | 1.3 |
| Accommodation and food service activities | 0.5 | 0.9 | 1.0 | 1.7 |
| Information and communication | 0.3 | 0.6 | 1.6 | 1.4 |
| Financial and insurance activities | 0.8 | 0.9 | 2.5 | 3.3 |
| Real estate activities | 1.1 | 0.7 | 3.6 | 3.8 |
| Professional, scientific and technical activities | 0.7 | 1.5 | 2.0 | 2.0 |
| Administrative and support service activities | –0.2 | 0.3 | 1.0 | 0.0 |
| Construction | 1.0 | 0.4 | 1.8 | 1.6 |
| TOTAL | 0.5 | 0.6 | 1.6 | 1.6 |
- Scope: non-agricultural market sector excluding household services Sources: ACOSS, DARES, INSEE
Total quartely variation confirmed for the Q4 2015
The LCI - wages and salaries in the fourth quarter of 2015 in the non-agricultural market sector excluding household services is unchanged quarter-on-quarter. It has been reviewed by +0.1 points year-on-year.
The labour cost index - total labour cost increased by 1.2%
In the first quarter of 2016, the labour cost index (LCI) - total labour cost in the non-agricultural market sector sped up sharply quarter-on-quarter (+1.2% in seasonally adjusted data, after +0.5% in Q4 2015). This acceleration is mainly due to a new measure, which was lauched on the January 1st 2016. Employers in the private sector have to offer a complementary health insurance to their employees. The measure effect on the whole index has been estimated at +0.5 points for Q1 2016.
Year-on-year, the LCI - total labour cost also accelerated strongly (+2.1% after +1.2%). Without the tax credit for encouraging competitiveness and jobs (CICE), the growth would have been the same.
graphiqueGraphSCangl – LCI - total labor cost: year-on-year changes
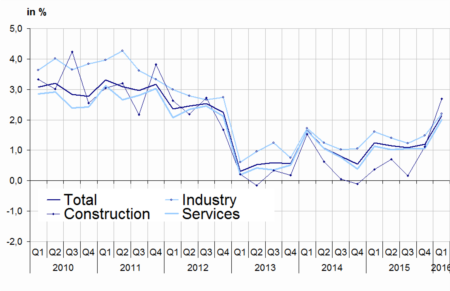
- Scope: non-agricultural market sector excluding household services Sources: Acoss, Dares, Insee
Slight upward revision of Q4 2015 LCI – total labour cost
The variation of LCI – total labour cost in the fourth quarter of 2015, in the non-agricultural market sector excluding household services has been revised upwards by 0.1 percentage points, year-on-year as well as quarter-on-quarter. The updated CICE data leaded to revise slightly some of the y-o-y sector variations.
tableautableauSCangl – LCI - total labor cost
| Quarterly variations (%) | Annual variations (%) | |||
|---|---|---|---|---|
| Q4-15 | Q1-16 | Q4-15 | Q1-16 | |
| Industry | 0.6 | 0.9 | 1.5 | 2.2 |
| Mining and quarrying | 0.4 | 0.7 | 0.0 | 1.2 |
| Manufacturing | 0.7 | 1.0 | 1.5 | 2.3 |
| Electricity, gas, steam and air conditioning supply | 0.1 | 0.3 | 1.5 | 1.5 |
| Water supply; sewerage, waste management and remediation act. | 0.2 | 0.4 | 0.8 | 1.0 |
| Services | 0.3 | 1.2 | 1.0 | 2.0 |
| Wholesale and retail trade; repair of motor vehicles and motorcycles | 0.4 | 1.1 | 1.0 | 2.3 |
| Transportation and storage | 0.2 | 0.6 | 0.4 | 1.5 |
| Accommodation and food service activities | 0.5 | 1.6 | 0.1 | 2.4 |
| Information and communication | 0.3 | 1.0 | 1.7 | 1.7 |
| Financial and insurance activities | 0.8 | 1.1 | 2.5 | 3.6 |
| Real estate activities | 1.2 | 1.2 | 3.4 | 4.5 |
| Professional, scientific and technical activities | 0.7 | 2.0 | 1.9 | 2.5 |
| Administrative and support service activities | -0.4 | 1.4 | -0.2 | 0.8 |
| Construction | 1.0 | 1.5 | 1.1 | 2.7 |
| TOTAL | 0.5 | 1.2 | 1.2 | 2.1 |
tableautableauhCICEangl – LCI - total labor cost (without CICE)
| Quarterly variations (%) | Annual variations (%) | |||
|---|---|---|---|---|
| Q4-15 | Q1-16 | Q4-15 | Q1-16 | |
| Industry | 0.6 | 0.9 | 1.5 | 2.2 |
| Mining and quarrying | 0.4 | 1.1 | 0.4 | 1.6 |
| Manufacturing | 0.7 | 1.0 | 1.5 | 2.3 |
| Electricity, gas, steam and air conditioning supply | 0.1 | 0.3 | 1.6 | 1.5 |
| Water supply; sewerage, waste management and remediation act. | 0.2 | 0.4 | 0.8 | 1.1 |
| Services | 0.3 | 1.2 | 1.0 | 2.0 |
| Wholesale and retail trade; repair of motor vehicles and motorcycles | 0.4 | 1.1 | 1.0 | 2.3 |
| Transportation and storage | 0.2 | 0.6 | 0.3 | 1.5 |
| Accommodation and food service activities | 0.5 | 1.6 | 0.0 | 2.4 |
| Information and communication | 0.3 | 1.0 | 1.6 | 1.7 |
| Financial and insurance activities | 0.8 | 1.1 | 2.4 | 3.6 |
| Real estate activities | 1.2 | 1.2 | 3.4 | 4.5 |
| Professional, scientific and technical activities | 0.7 | 2.0 | 1.9 | 2.4 |
| Administrative and support service activities | –0.4 | 1.4 | –0.1 | 0.8 |
| Construction | 1.0 | 1.5 | 1.2 | 2.7 |
| TOTAL | 0.5 | 1.1 | 1.2 | 2.1 |
- Scope: non-agricultural market sector excluding household services Sources: ACOSS, DARES, INSEE
Documentation
Methodological Note (pdf,132 Ko)
Estimate of effects of new 2016 measures (pdf,164 Ko)
Supplementary Methodological Note SA-WDA (pdf,257 Ko)
Pour en savoir plus
