


 14 June 2016
2016- n° 151In May 2016, oil prices accelerated Prices of oil and raw material imports - May 2016
14 June 2016
2016- n° 151In May 2016, oil prices accelerated Prices of oil and raw material imports - May 2016
In May 2016, the crude oil price in euros kept recovering (+11.9% after +6.1%). At €42.1 on average per barrel, the Brent price remained howeversignificantly lower than one year ago (-27.9%).
In May 2016, the crude oil price in euros kept recovering (+11.9% after +6.1%). At €42.1 on average per barrel, the Brent price remained howeversignificantly lower than one year ago (−27.9%).
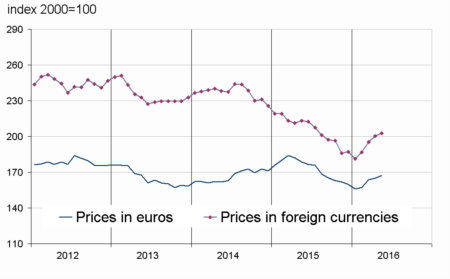
Prices in euros of the other imported commodities accelerated modestly (+1.3% after +0.8%). In effect, raw food materials prices picked up markedly (+6.7% after −0.5%). On the other hand, industrial raw materials prices weakened (−2.1% after +1.7%).
Oil prices increased more than in April
In May, the price of crude oil from the North Sea (Brent) in euros gathered pace (+11.9% after +6.1%). In dollars, the price rise was a little less marked (+11.6% after +8.1%) since the euro depreciated slightly during the month.
tableautabpetrole – Oil and petroleum products
| Prices | Change (%) | |||
|---|---|---|---|---|
| of last month | over the last month | over the last 3 months | over the last 12 months | |
| Brent in $ per barrel | 47.1 | 11.6 | 42.0 | –27.0 |
| Brent in € per barrel | 41.7 | 11.9 | 39.3 | –27.9 |
| Gasoline €/L | 0.37 | 9.4 | 62.2 | –19.9 |
| Gas Oil | 375.3 | 15.0 | 36.3 | –30.2 |
| Heavy fuel | 215.0 | 12.3 | 39.4 | –34.9 |
| Naphtha | 349.8 | 7.0 | 33.5 | –29.7 |
- Prices are in euros per tonne unless otherwise specified
- Source: INSEE
graphiqueG_petrole_ang – Oil (Brent)

- Source: INSEE
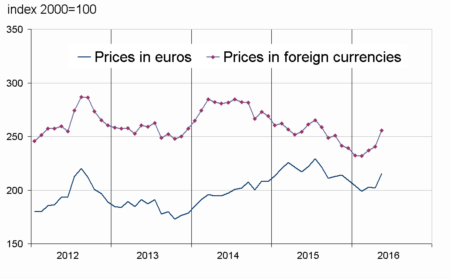
Prices of raw food materials recovered
Prices of raw food materials in euros picked up sharply in May (+6.7% after −0.5%). Sugar prices rallied strongly (+11.6% after −4.6%), driven up by lower outputs in India and in China. The price of soybean meals sped up strongly (+24.3% after +8.0%) and propped up prices of oil seeds and vegetable oils that accelerated (+12.5% after +4.9%), even though the price of palm oil slipped (−5.1% after +5.6%). Prices of cereals increased as well (+7.2% after +0.1%), in particular those of corn (+4.8% after +0.6%) and rice (+9.1% after −0.4%), as a result of greater worldwide demand. Prices of tropical foodstuffs edged up (+1.4% after −2.1%), due in particular to the acceleration in robusta prices (+4.2% after +3.4%).
graphiqueG_alim_ang – Food
- Source: INSEE
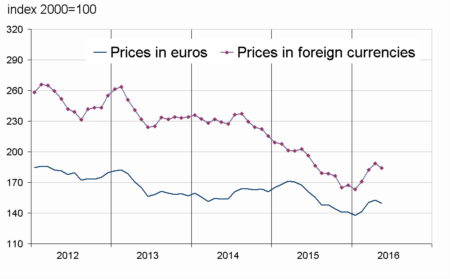
Prices of industrial raw materials slipped back
Prices of industrial raw materials in euros shrank (−2.1% after +1.7%), due to a downturn in minerals prices (−3.0% after +1.8%). Prices of iron ore fell back (−7.6% after +5.3%), on account of high stock levels in China. Prices of non-ferrous metals declined too (−2.1% after +0.9%) because of a drop in copper prices (−6.6% after +2.0%), due to lower demand in China, and a sharp backlash in lead prices (−5.5% after +3.4%). Prices of precious metals decreased as well (−0.7% after +2.2%), mainly those of platinum (−8.7% after +8.3%) and palladium (−11.9% after +8.5%). However, prices of agricultural raw materials rose as much as in April (+1.2%), in spite of the substantial decline in natural rubber prices (−10.9% after +17.2%; −21.2% over one year).
graphiqueG_indus_ang – Industrial raw materials
- Source: INSEE
graphiqueG_ensemble_ang – Imported raw materials (excluding energy)
- Source: INSEE
tableautabmatprem – Imported raw materials (excluding energy) in euros
| Index | Changes (%) | |||
|---|---|---|---|---|
| of last month | over the last month | over the last 3 months | over the last 12 months | |
| Food total | 215.3 | 6.7 | 8.1 | –0.8 |
| Tropical foodstuffs | 201.6 | 1.4 | 3.3 | –4.2 |
| Oil seeds, vegetable oils | 248.3 | 12.5 | 18.4 | 6.8 |
| Cereals | 159.0 | 7.2 | 6.6 | 6.0 |
| Sugar | 165.3 | 11.6 | 22.9 | 29.6 |
| Beef meat | 150.7 | –0.1 | –7.2 | –18.5 |
| Industrial raw materials | 149.6 | –2.1 | 5.6 | –10.5 |
| Agricultural raw materials | 112.8 | 1.2 | 8.6 | 0.7 |
| Natural Fibres | 119.8 | 1.4 | 3.3 | –3.9 |
| Natural rubber | 140.6 | –10.9 | 25.2 | –21.2 |
| Hides | 72.9 | –1.2 | –0.5 | –26.0 |
| Wood pulp | 95.3 | 1.0 | –1.6 | –8.1 |
| Tropical wood | 107.2 | 1.9 | –0.4 | –7.2 |
| Sawn softwood | 101.3 | 6.7 | 23.9 | 22.2 |
| Minerals | 169.9 | –3.0 | 5.2 | –13.9 |
| Iron ore | 359.3 | –7.6 | 16.5 | –10.1 |
| Non-ferrous metals | 140.6 | –2.1 | 3.4 | –15.9 |
| Precious metals | 233.5 | –0.7 | 4.9 | –5.5 |
| All commodities | 167.1 | 1.3 | 6.4 | –6.3 |
- Source: INSEE
Pour en savoir plus
Time series : Raw materials prices
