


 30 June 2016
2016- n° 172In April 2016, the turnover declined in the manufacturing industry (–1.2%) Turnover in industry and construction - April 2016
30 June 2016
2016- n° 172In April 2016, the turnover declined in the manufacturing industry (–1.2%) Turnover in industry and construction - April 2016
In April 2016, the turnover declined in the manufacturing industry (-1.2%) after a virtual stability in March (–0.1%). Exports continued to decline, more substantially than in March (-1.6% after -0.6%).

Every index in this issue is in value (tax excluded), seasonally and working day adjusted. The commentary shows variations of subsections by decreasing contribution. The contribution of a subsection depends on the extent of the change and on its weight.
In April 2016, the turnover declined in the manufacturing industry (−1.2%) after a virtual stability in March (–0.1%). Exports continued to decline, more substantially than in March (−1.6% after −0.6%).
In the industry as a whole, the turnover decreased more moderately than in the manufacturing industry in April (–0.7%), owing to a rebound in the mining and quarrying; energy; water supply; waste management sector (+1.7%, after –1.2% in March).
Fall over the last three months (–1.6%)
Over the last three months, the turnover dropped in the manufacturing industry (–1.6%) as well as in the industry as a whole (−1.1%).
Over this period, it plummeted in the manufacture of coke and refined petroleum products (−11.1%). It declined sharply in the manufacture of transport equipment (−3.4%), owing to the manufacture of other transport equipment (–5.9%). It fell more moderately in other manufacturing (−0.7%), in the manufacture of food products and beverages (–0.7%) and in the capital goods industry (–0.5%). Conversely, it recovered in the mining and quarrying, energy, water supply, waste management (+1.2% over three months, after –1.3% in March).
Decline compared to the previous year (−1.6%)
In the manufacturing industry, the turnover declined over the last three months, compared to the same months of 2015 (−1.6%, y-o-y). It dropped as well in the industry as a whole (–1.3%).
Over this period, the turnover plummetted in the manufacture of coke and refined petroleum products (−25.2%). It went down in other manufacturing (–0.7%) and more moderately in the manufacture of food products and beverages (–0.3%) and the mining and quarrying, energy, water supply, waste management sector (–0.4%). On the other hand, it went up in the manufacture of transport equipment (+0.5%) and in the capital goods industry (+0.6%).
graphiqueIRgraph3 – Turnover in manufacturing industry
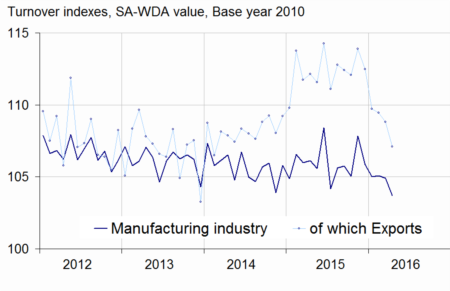
- Source: INSEE
graphiqueIRGraph4 – Turnover in manufacturing industry by sector
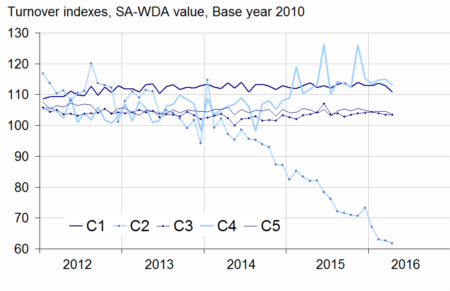
- Source: INSEE
tableauIRtab5 – Variation of the turnover in industry and construction
| Change in % | |||||
|---|---|---|---|---|---|
| NA : A 10, (A 17) | Weight** | Apr./ Mar. | Mar./ Feb. | q-o-q (1) | y-o-y (2) |
| BE: INDUSTRY | 10000 | –0.7 | –0.3 | –1.1 | –1.3 |
| CZ: MANUFACTURING INDUSTRY | 8346 | –1.2 | –0.1 | –1.6 | –1.6 |
| Of which Exports | 2677 | –1.6 | –0.6 | –3.2 | –3.6 |
| (C1): Manufacture of food products and beverages | 1685 | –1.8 | –0.7 | –0.7 | –0.3 |
| (C2): Manufacture of coke and refined petroleum products | 561 | –1.5 | –0.4 | –11.1 | –25.2 |
| (C3): Capital goods industry | 953 | 0.0 | –0.5 | –0.5 | 0.6 |
| (C4): Manufacture of transport equipment | 1265 | –1.6 | 0.2 | –3.4 | 0.5 |
| (C5): Other manufacturing | 3881 | –0.9 | 0.1 | –0.7 | –0.7 |
| DE: Mining and quarrying; energy; water supply; waste management | 1654 | 1.7 | –1.2 | 1.2 | –0.4 |
| FZ: CONSTRUCTION | 10000 | –0.2 | –1.7 | –0.5 | 0.1 |
- ** 10000=B...E and F
- (1) Quarter-on-quarter: last three months / previous three months
- (2) Year-on-year: last three months / same three months of previous year
- The codes correspond to different levels of aggregation of the NACE classification.
- Source: INSEE
Decline in “other manufacturing” (–0.9%)
The turnover in “other manufacturing” fell in April (−0.9%) after a virtual stability in March (+0.1%). Except for the pharmaceutical products, it went down in all sectors, mainly in the manufacture of basic metals and fabricated metal products (–3.3%) and, to a lesser extent, in the manufacture of chemicals and chemical products (–0.7%) and the manufacture of wood and paper products and printing(–0.6%). Conversely, it grew substantially in the manufacture of basic pharmaceutical products and pharmaceutical preparations (+1.3%).
New decline in food products and beverages (–1.8%)
The turnover declined again in the manufacture of food products and beverages (–1.8% in April, after –0.7%).
Decline in transport equipments (–1.6%)
The turnover in the manufacture of transport equipment shrunk in April (–1.6%, after +0.2% in March), owing to a dramatic fall in exports (–4.5%, after +1.7%). It dropped sharply in the manufacture of other transport equipment (–3.5%, after +1.2%) while it bounced back moderately in the manufacture of motor vehicles. (+0.4%, after –0.8%).
New fall in coke and refined petroleum products (−1.5%)
In April, the turnover fell once again in the manufacture of coke and refined petroleum products (–1.5%), more considerably than in March (–0.4%).
Stability in capital goods
The turnover in the capital goods industry levelled off in April after a fall for two months in a row (–0.5% in March and –0.4% in February). It rebounded in the manufacture of machinery and equipment n.e.c. (+1.1%) while it fell back in the manufacture of computer, electronic and optical products (–0.9%) and in the manufacture of electrical equipment (–1.0%).
Revisions: +0.1 points in March in the manufacturing industry
In the manufacturing industry, the variation of the turnover in March 2016 has been revised upwards, at –0.1% instead of –0.2% published previously. It has been revised downwards by –0.1 points in the industry as a whole.
tableauIRtab8 – Indices of turnover in industry and construction
| Change in % | |||||
|---|---|---|---|---|---|
| Industries: | Weight* | Apr. 2016 | Apr./ Mar. | Mar./ Feb. | q-o-q (1) |
| BE: INDUSTRY | 10000 | 105.5 | –0.7 | –0.3 | –1.1 |
| CZ: MANUFACTURING INDUSTRY | 8346 | 103.7 | –1.2 | –0.1 | –1.6 |
| of which Exports | 2677 | 107.1 | –1.6 | –0.6 | –3.2 |
| (C1): Man. of food products and beverages | 1685 | 110.9 | –1.8 | –0.7 | –0.7 |
| of which Exports | 285 | 113.0 | –1.9 | –2.4 | –0.3 |
| (C2): Man. of coke and refined petroleum products | 561 | 61.8 | –1.5 | –0.4 | –11.1 |
| (C3): Capital goods industry | 953 | 103.5 | 0.0 | –0.5 | –0.5 |
| of which Exports | 469 | 100.6 | –0.2 | –1.4 | –1.4 |
| [CI] Man. of computer, electronic and optical products | 306 | 100.7 | –0.9 | 1.2 | –0.4 |
| [CJ] Man. of electrical equipment | 245 | 97.1 | –1.0 | 0.4 | –0.7 |
| [CK] Man. of machinery and equipment n.e.c. | 402 | 109.4 | 1.1 | –2.1 | –0.5 |
| (C4): Man. of transport equipment | 1265 | 113.1 | –1.6 | 0.2 | –3.4 |
| of which Exports | 617 | 116.8 | –4.5 | 1.7 | –5.8 |
| [CL1] Man. of motor vehicles, trailers and semi-trailers | 702 | 99.2 | 0.4 | –0.8 | –0.4 |
| [CL2] Man. of other transport equipment | 562 | 130.5 | –3.5 | 1.2 | –5.9 |
| (C5): Other manufacturing | 3881 | 103.6 | –0.9 | 0.1 | –0.7 |
| of which Exports | 1237 | 105.9 | –0.4 | –1.0 | –2.3 |
| [CB] Man. of textiles, wearing apparel, leather and related products | 188 | 108.3 | –0.2 | 0.6 | –1.0 |
| [CC] Man. of wood and paper products; printing and reproduction of recorded media | 436 | 96.2 | –0.6 | –0.9 | –1.5 |
| [CE] Man. of chemicals and chemical products | 745 | 98.8 | –0.7 | –0.3 | –1.9 |
| [CF] Man. of basic pharmaceutical products and pharmaceutical preparations | 304 | 109.7 | 1.3 | –0.2 | –0.5 |
| [CG] Man. of rubber and plastics products, and other non-metallic mineral products | 629 | 102.0 | –0.1 | –0.7 | –0.9 |
| [CH] Man. of basic metals and fabricated metal products, except machinery and equipment | 926 | 99.9 | –3.3 | 2.3 | –0.4 |
| [CM] Other manufacturing; repair and installation of machinery and equipment | 653 | 116.8 | –0.2 | –0.9 | 0.8 |
| DE: Mining and quarrying; energy, water supply, sewerage, waste management | 1654 | 114.3 | 1.7 | –1.2 | 1.2 |
| [BZ] Mining and quarrying | 70 | 90.6 | 0.0 | –0.8 | –3.7 |
| [DZ] Electricity, gas, steam and air-conditioning supply | 1205 | 117.5 | 2.8 | –1.1 | 1.7 |
| [EZ] Water supply; sewerage, waste management and remediation | 379 | 108.4 | –1.8 | –1.5 | 0.2 |
| FZ: CONSTRUCTION | 10000 | 102.5 | –0.2 | –1.7 | –0.5 |
- ** 10000=B...E and F
- (1) Quarter-on-quarter: last three months / previous three months
- Source: INSEE
tableauIRtab7 – Measure of variation revisions
| Mar./ Feb. | Feb./ Jan. | Jan./ Dec. | Q4 2014/ Q3 2014 | 2014/ 2013 | |
|---|---|---|---|---|---|
| Industry (BE) | –0.10 | –0.06 | 0.01 | –0.12 | –0.05 |
| raw serie | –0.45 | –0.03 | 0.04 | –0.12 | –0.04 |
| SA-WDA coeff. | 0.35 | –0.03 | –0.03 | 0.00 | –0.01 |
| Manufacturing industry (CZ) | 0.02 | –0.04 | 0.00 | –0.11 | –0.06 |
| raw serie | –0.07 | –0.02 | 0.05 | 0.00 | –0.05 |
| SA-WDA coeff. | 0.10 | –0.02 | –0.05 | –0.11 | –0.01 |
- How to read it: in the manufacturing, the SA-WDA variation between February and March 2016 is revised by +0.02 points: –0.07 points are due to the revision of raw series and +0.10 points to the new calculation of the SA-WDA coefficients.
- Source: INSEE
Documentation
Methodology (pdf,140 Ko)
Pour en savoir plus
Time series : Turnover indices (VAT)
