


Quarterly national accounts in Q1 2016 National accounts in base 2010 - Detailed figures
In Q1 2016, households’ purchasing power and corporations’ profit ratio increased again Quarterly national accounts - detailed figures - 1st Quarter 2016
In Q1 2016, gross domestic product (GDP) in volume terms* accelerated: +0.6% after +0.4% at the end of 2015. The previous estimate, published on 30 May 2016, is thereby confirmed.
In Q1 2016, gross domestic product (GDP) in volume terms* accelerated: +0.6% after +0.4% at the end of 2015. The previous estimate, published on 30 May 2016, is thereby confirmed.
Household final consumption expenditure recovered markedly at the beginning of 2016 (+1.1% after +0.1%) and total gross fixed capital formation (GFCF) accelerated (+1.4% after +1.0%). All in all, final domestic demand excluding inventory changes contributed +1.0 points to GDP growth (after +0.4 points at the end of 2015). Exports came to a standstill this quarter (0.0% after +0.8%) whereas imports slowed down strongly (+0.8% after +2.8%). Thus, foreign trade balance acted as a drag on GDP growth again (−0.2 points after −0.6 points). Changes in inventories made a negative contribution at the beginning of the year: −0.2 points after +0.6 points at the end of 2015.
graphiqueGraph1 – GDP and its main components
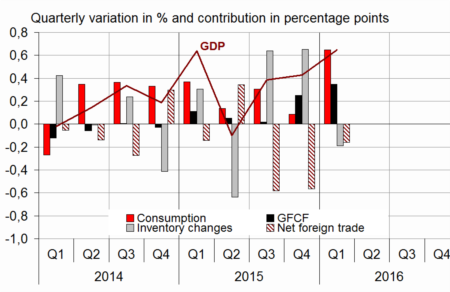
- Source: INSEE
tableauTab1 – Goods and services:supply and uses chain-linked volumes
| 2015 Q2 | 2015 Q3 | 2015 Q4 | 2016 Q1 | 2015 | 2016 (ovhg) | |
|---|---|---|---|---|---|---|
| GDP | -0.1 | 0.4 | 0.4 | 0.6 | 1.2 | 1.1 |
| Imports | 0.2 | 1.8 | 2.8 | 0.8 | 6.4 | 3.8 |
| Household consumption *expenditure | 0.1 | 0.5 | 0.1 | 1.1 | 1.5 | 1.5 |
| General government's *consumption expenditure | 0.4 | 0.3 | 0.5 | 0.5 | 1.4 | 1.1 |
| GFCF | 0.2 | 0.1 | 1.0 | 1.4 | 0.9 | 2.3 |
| *of which Non-financial corporated and unincorporated enterprises | 0.6 | 0.4 | 1.6 | 2.1 | 2.7 | 3.7 |
| Households | -0.2 | -0.1 | 0.0 | 0.2 | -0.8 | 0.1 |
| General government | -0.2 | -0.7 | 0.7 | 0.9 | -3.9 | 1.1 |
| Exports | 1.6 | -0.3 | 0.8 | 0.0 | 6.0 | 0.8 |
| Contributions : | ||||||
| Internal demand excluding inventory changes | 0.2 | 0.4 | 0.4 | 1.0 | 1.3 | 1.5 |
| Inventory changes | -0.7 | 0.7 | 0.6 | -0.2 | 0.2 | 0.5 |
| Net foreign trade | 0.4 | -0.7 | -0.6 | -0.2 | -0.3 | -0.9 |
- Source: INSEE
Households’ purchasing power accelerated
In nominal terms, households’ gross disposable income (GDI) accelerated in Q1 (+0.6% after +0.4%). Indeed, wages received by households accelerated slightly (+0.8% after +0.7%) and taxes on income and wealth decelerated strongly this quarter (+0.3% after +2.5%).
On the other hand, social benefits in cash slowed down (+0.4% after +0.6%) and social contributions paid accelerated (+0.9% after +0.6%), notably due to the increase in the rates of pension contribution on the 1st January.
Household consumption prices were stable as in the previous quarter. As a result, household purchasing power accelerated (+0.6% after +0.4% at the end of 2015). Measured per consumption unit, it also accelerated (+0.5% after +0.3%).

* This growth rate is seasonally and working-day adjusted; volumes are chain-linked previous-year-prices volumes.
tableauTab2 – Sectoral accounts
| 2015 Q2 | 2015 Q3 | 2015 Q4 | 2016 Q1 | 2015 | 2016 (ovhg) | |
|---|---|---|---|---|---|---|
| Profit ratio of NFC* (level) | 31.1 | 31.3 | 31.6 | 32.1 | 31.4 | |
| Household purchasing power | 0.0 | 0.7 | 0.4 | 0.6 | 1.6 | 1.3 |
- *NFC: non-financial corporations
- Source: INSEE
In Q1 2016, household consumption increased more quickly than their purchasing power, so that their saving ratio decreased. After an increase of 0.3 points in the previous quarter, at 14.8%, it returned to its average level over the three first quarters of 2015, at 14.4%.
tableauTab3 – Production, consumption and GFCF: main components
| 2015 Q2 | 2015 Q3 | 2015 Q4 | 2016 Q1 | 2015 | 2016 (ovhg) | |
|---|---|---|---|---|---|---|
| Production of branches | -0.1 | 0.4 | 0.6 | 0.7 | 1.3 | 1.3 |
| Goods | -0.8 | 0.5 | 0.5 | 0.3 | 1.2 | 0.7 |
| Manufactured Industry | -0.6 | 0.5 | 0.7 | 0.2 | 1.5 | 0.8 |
| Construction | -0.5 | -0.5 | 0.4 | 0.5 | -2.2 | 0.5 |
| Market services | 0.1 | 0.5 | 0.7 | 1.0 | 1.8 | 1.8 |
| Non-market services | 0.3 | 0.3 | 0.4 | 0.5 | 1.0 | 1.0 |
| Household consumption | 0.1 | 0.5 | 0.1 | 1.1 | 1.5 | 1.5 |
| Food products | 1.1 | -0.2 | 0.3 | 0.4 | 1.2 | 0.8 |
| Energy | -2.9 | 2.5 | -2.5 | 1.7 | 1.5 | 0.3 |
| Engineered goods | 0.2 | 0.7 | 0.1 | 2.2 | 2.6 | 2.7 |
| Services | 0.1 | 0.4 | 0.3 | 0.7 | 1.0 | 1.2 |
| GFCF | 0.2 | 0.1 | 1.0 | 1.4 | 0.9 | 2.3 |
| Manufactured goods | 1.0 | 0.2 | 3.2 | 4.1 | 2.1 | 6.9 |
| Construction | -0.5 | -0.5 | 0.3 | 0.5 | -2.2 | 0.3 |
| Market services | 0.8 | 0.8 | 0.7 | 1.0 | 4.4 | 2.1 |
- Source: INSEE
tableauTab4 – Households’ disposable income and ratios of households’ account
| 2015 Q2 | 2015 Q3 | 2015 Q4 | 2016 Q1 | 2015 | 2016 (ovhg) | |
|---|---|---|---|---|---|---|
| HDI | 0.2 | 0.6 | 0.4 | 0.6 | 1.4 | 1.3 |
| Household purchasing power | 0.0 | 0.7 | 0.4 | 0.6 | 1.6 | 1.3 |
| HDI by cu* (purchasing power) | -0.1 | 0.6 | 0.3 | 0.5 | 1.2 | 1.0 |
| Adjusted HDI (purchasing power) | 0.1 | 0.7 | 0.4 | 0.6 | 1.6 | 1.3 |
| Saving rate (level) | 14.3 | 14.5 | 14.8 | 14.4 | 14.5 | |
| Financial saving rate (level) | 5.3 | 5.6 | 5.8 | 5.6 | 5.5 |
- *cu: consumption unit
- Source: INSEE
Non-financial corporations’ profit ratio at its highest level since the crisis of 2008
In Q1 2016, non-financial corporations’ profit ratio increased again, from 31.6% to 32.1%: it reached its highest level since Q4 2008.
The decrease in energy prices bolstered the profit ratio this quarter again, by improving terms of trade. However, productivity gains and real wages increase virtually balanced each other.
tableauTab5 – Ratios of non-financial corporations’ account
| 2015 Q2 | 2015 Q3 | 2015 Q4 | 2016 Q1 | 2015 | |
|---|---|---|---|---|---|
| Profit share | 31.1 | 31.3 | 31.6 | 32.1 | 31.4 |
| Investment ratio | 22.9 | 22.8 | 23.0 | 23.2 | 22.9 |
| Savings ratio | 19.4 | 19.9 | 20.1 | 21.2 | 19.7 |
| Self-financing ratio | 84.5 | 87.2 | 87.3 | 91.5 | 86.3 |
- Source: INSEE
In Q1, general government deficit increased anew
In Q1 2016, general government net borrowing rose anew and reached −3.4 points of GDP after −2.8 points in Q4 2015.
Spending bounced back in Q1 (+1.0% after −0.3%), mainly as a backlash of the decrease in the French contribution to the European Union budget the previous quarter. However, operating expenditures decelerated (+0.2% after +0.4%) and the contribution of the debt interests kept on decreasing (−1.4% after −2.5%), because the past price slowdown reduces interests paid on inflation-linked government bonds.
Receipts shrank in Q1 (−0.2% after +1.4%) due to a downturn in corporation tax. The acceleration in production taxes (VAT and TICPE, notably) and that in revenue from social contributions only partly offset it.
tableauTab6 – Expenditure, receipts and net borrowing of public administrations
| 2015 Q2 | 2015 Q3 | 2015 Q4 | 2016 Q1 | 2015 | |
|---|---|---|---|---|---|
| In billions of euros | |||||
| Total expenditure | 312.1 | 311.4 | 310.4 | 313.6 | 1243.3 |
| Total receipts | 290.3 | 291.3 | 295.2 | 294.6 | 1165.9 |
| Net lending (+) or borrowing (-) | -21.8 | -20.1 | -15.1 | -19.0 | -77.3 |
| In % of GDP | |||||
| Net lending (+) or borrowing (-) | -4.0 | -3.7 | -2.8 | -3.4 | -3.5 |
- Source: INSEE
Avertissement
Quarterly national accounts
Quarterly debt of the general government
Sources
Quarterly national accounts
Quarterly accounts are a consistent set of indicators which provides a global overview of recent economic activity.
Time series of the main aggregates of quarterly national accounts can be accessed through the "Summary". They are classified into eight categories:
- Gross domestic product (GDP) and main economic aggregates ;
- Goods and services ;
- Households' consumption ;
- Foreign trade ;
- Activities ;
- Institutional sectors ;
- Households' income and purchasing power ;
- Public finances.
For each category, are available :
- synthetic files displaying from the accounts the relevant information for economic analysis ,
- sometimes, one or two files displaying all the data available.
Documentation
Abbreviated methodology (pdf, 140 Ko )
Methodology - First estimate at 30 days (pdf, 112 Ko )