


Quarterly national accounts in Q1 2016 National accounts in base 2010 - Detailed figures
In Q1 2016, household consumption sustained French GDP growth (+0.5%) Quarterly national accounts - first estimate - 1st Quarter 2016
In Q1 2016, GDP in volume terms* increased by 0.5%, after +0.3% in Q4 2015. Household consumption expenditure recovered strongly (+1.2% after -0.1%). Total gross fixed capital formation (GFCF) kept increasing (+0.9% after +0.7%). Overall, final domestic demand excluding inventory changes accelerated and contributed for +0.9 points to GDP growth (after +0.2 points in the end of 2015). Exports fell back slightly (-0.2% after +1.0%) while imports slowed down (+0.5% after +2.1%). In fine, foreign trade balance weighed again on GDP growth: -0.2 points after -0.4 points. Changes in inventories also contributed negatively (-0.2 points after +0.5 points).
In Q1 2016, GDP in volume terms* increased by 0.5%, after +0.3% in Q4 2015. Household consumption expenditure recovered strongly (+1.2% after −0.1%). Total gross fixed capital formation (GFCF) kept increasing (+0.9% after +0.7%). Overall, final domestic demand excluding inventory changes accelerated and contributed for +0.9 points to GDP growth (after +0.2 points in the end of 2015). Exports fell back slightly (−0.2% after +1.0%) while imports slowed down (+0.5% after +2.1%). In fine, foreign trade balance weighed again on GDP growth: −0.2 points after −0.4 points. Changes in inventories also contributed negatively (−0.2 points after +0.5 points).

* This growth rate is seasonally and working-day adjusted; volumes are chain-linked previous-year-prices volumes.
graphiqueGraph1 – GDP and its main components
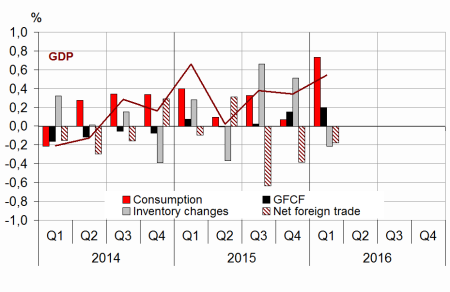
- Source: INSEE
tableauTab1 – Goods and services:supply and uses chain-linked volumes
| 2015 Q2 | 2015 Q3 | 2015 Q4 | 2016 Q1 | 2015 | 2016 (ovhg) | |
|---|---|---|---|---|---|---|
| GDP | 0.0 | 0.4 | 0.3 | 0.5 | 1.2 | 1.0 |
| Imports | 0.9 | 1.8 | 2.1 | 0.5 | 6.4 | 3.1 |
| Household consumption *expenditure | 0.0 | 0.4 | -0.1 | 1.2 | 1.4 | 1.3 |
| General government's *consumption expenditure | 0.3 | 0.4 | 0.5 | 0.4 | 1.5 | 1.1 |
| GFCF | 0.0 | 0.1 | 0.7 | 0.9 | 0.0 | 1.5 |
| *of which Non-financial corporated and unincorporated enterprises | 0.5 | 0.4 | 1.0 | 1.6 | 2.1 | 2.8 |
| Households | -0.9 | -0.5 | -0.9 | -0.2 | -2.7 | -1.4 |
| General government | -0.6 | 0.1 | 1.8 | 0.1 | -3.0 | 1.3 |
| Exports | 2.0 | -0.3 | 1.0 | -0.2 | 6.1 | 0.9 |
| Contributions : | ||||||
| Internal demand excluding inventory changes | 0.1 | 0.4 | 0.2 | 0.9 | 1.2 | 1.3 |
| Inventory changes | -0.4 | 0.7 | 0.5 | -0.2 | 0.3 | 0.4 |
| Net foreign trade | 0.3 | -0.6 | -0.4 | -0.2 | -0.3 | -0.7 |
- Source: Insee
Total production increased again
Production in goods and services increased again in Q1 2016 (+0.6% as in the previous quarter). Output in manufacturing industry slowed down (+0.3% after +0.9%), in almost all branches. Conversely, production sped up in energy (+1.1% after +0.2%) and in market services (+0.9% after +0.6%). Production in construction remained almost stable (−0.1% after +0.2%).
tableauTab3 – Production, consumption and GFCF: main components
| 2015 Q2 | 2015 Q3 | 2015 Q4 | 2016 Q1 | 2015 | 2016 (ovhg) | |
|---|---|---|---|---|---|---|
| Production of branches | -0.1 | 0.4 | 0.6 | 0.6 | 1.3 | 1.2 |
| Goods | -0.7 | 0.4 | 0.7 | 0.4 | 1.4 | 1.0 |
| Manufactured Industry | -0.4 | 0.5 | 0.9 | 0.3 | 1.6 | 1.1 |
| Construction | -0.8 | -0.8 | 0.2 | -0.1 | -2.8 | -0.5 |
| Market services | 0.2 | 0.5 | 0.6 | 0.9 | 1.9 | 1.6 |
| Non-market services | 0.3 | 0.3 | 0.4 | 0.4 | 1.1 | 1.0 |
| Household consumption | 0.0 | 0.4 | -0.1 | 1.2 | 1.4 | 1.3 |
| Food products | 0.7 | 0.0 | 0.4 | 1.0 | 1.1 | 1.4 |
| Energy | -2.5 | 1.9 | -2.3 | 1.5 | 1.7 | 0.0 |
| Engineered goods | 0.0 | 1.1 | -0.4 | 2.4 | 2.5 | 2.6 |
| Services | 0.2 | 0.2 | 0.2 | 0.6 | 1.0 | 0.9 |
| GFCF | 0.0 | 0.1 | 0.7 | 0.9 | 0.0 | 1.5 |
| Manufactured goods | 0.1 | 1.4 | 2.5 | 2.6 | 2.3 | 5.3 |
| Construction | -1.0 | -0.8 | -0.2 | -0.1 | -3.3 | -0.9 |
| Market services | 1.1 | 0.5 | 0.7 | 1.2 | 3.2 | 2.3 |
- Source: INSEE
Household consumption picked up strongly
Household consumption expenditure increased strongly in Q1 2016 (+1.2% after −0.1%). This rise was the most significant since the end of 2004. It was mainly driven by the strong rebound in expenditure on goods (+1.7% after −0.5%) and, to a lesser extent, by the acceleration in consumption of services (+0.6% after +0.2%).
Consumption of engineered goods rebounded sharply (+2.4% after −0.4%), notably in housing equipment, car purchases and clothing. Similarly, consumption in energy (gaz, electricity and refined petroleum products) recovered considerably (+1.5% after −2.3%), with temperatures closer to seasonal norms than in the end of 2015.
Household consumption of services accelerated, particulary because of the rebound in the accommodation and food services (+1.0% after −0.7%).
Investment still increased
Global GFCF accelerated slightly in Q1 2016 (+0.9% after +0.7%). Manufactured goods' GFCF kept on grewing strongly (+2.6% after +2.5%), especially in capital goods and transport equipment. Investment in market services accelerated too (+1.2% after +0.7%). However, investment in construction was almost stable (−0.1% after −0.2%).
Foreign trade balance worsened again, but less than in the fourth quarter
In Q1 2016, imports slowed down strongly (+0.5% after +2.1%), particularly in hydrocarbons. Exports slipped back slightly (−0.2% after +1.0%), mainly because of transport equipment. Overall, foreign trade balance weighed on GDP growth again, by 0.2 points in this quarter (after −0.4 points).
Changes in inventories weighed on GDP growth
Changes in inventories contributed negatively to GDP growth to 0.2 points, after +0.5 points in Q4 2015, in particular those in refined petroleum products and capital goods.
Revisions: activity is slightly upscaled in Q3
The estimate of GDP growth in Q4 2015 is confirmed at +0.3%. Slight revisions about different aggregates are compensated; they are mainly due to the revision of indicators and to the update of seasonal and working day adjustment.
tableauTab2 – Sectoral accounts
| 2015 Q2 | 2015 Q3 | 2015 Q4 | 2016 Q1 | 2015 | |
|---|---|---|---|---|---|
| Profit ratio of NFC* (level) | 30.8 | 31.1 | 31.5 | 31.1 | |
| Household purchasing power | -0.2 | 0.9 | 0.4 | 1.8 |
- *NFC: non-financial corporations
- Source: INSEE
tableauTab4 – Households' disposable income and ratios of households' account
| 2015 Q2 | 2015 Q3 | 2015 Q4 | 2016 Q1 | 2015 | |
|---|---|---|---|---|---|
| HDI | 0.1 | 0.6 | 0.4 | 1.6 | |
| Household purchasing power | -0.2 | 0.9 | 0.4 | 1.8 | |
| HDI by cu* (purchasing power) | -0.3 | 0.7 | 0.3 | 1.3 | |
| Adjusted HDI (purchasing power) | -0.1 | 0.7 | 0.4 | 1.8 | |
| Saving rate (level) | 15.1 | 15.4 | 15.9 | 15.4 | |
| Financial saving rate (level) | 6.2 | 6.6 | 7.1 | 6.5 |
- *cu: consumption unit
- Source: INSEE
tableauTab5 – Ratios of non-financial corporations' account
| 2015 Q2 | 2015 Q3 | 2015 Q4 | 2016 Q1 | 2015 | |
|---|---|---|---|---|---|
| Profit share | 30.8 | 31.1 | 31.5 | 31.1 | |
| Investment ratio | 23.0 | 22.9 | 22.9 | 22.9 | |
| Savings ratio | 19.4 | 20.2 | 20.0 | 19.7 | |
| Self-financing ratio | 84.4 | 88.1 | 87.4 | 85.9 |
- Source: INSEE
tableauTab6 – Expenditure, receipts and net borrowing of public administrations
| 2015 Q2 | 2015 Q3 | 2015 Q4 | 2016 Q1 | 2015 | |
|---|---|---|---|---|---|
| In billions of euros | |||||
| Total expenditure | 312.0 | 311.5 | 310.5 | 1243.4 | |
| Total receipts | 290.7 | 290.4 | 294.8 | 1166.0 | |
| Net lending (+) or borrowing (-) | -21.3 | -21.1 | -15.7 | -77.4 | |
| In % of GDP | |||||
| Net lending (+) or borrowing (-) | -3.9 | -3.8 | -2.9 | -3.5 |
- Source: INSEE
Avertissement
Quarterly national accounts
Quarterly debt of the general government
Sources
Quarterly national accounts
Quarterly accounts are a consistent set of indicators which provides a global overview of recent economic activity.
Time series of the main aggregates of quarterly national accounts can be accessed through the "Summary". They are classified into eight categories:
- Gross domestic product (GDP) and main economic aggregates ;
- Goods and services ;
- Households' consumption ;
- Foreign trade ;
- Activities ;
- Institutional sectors ;
- Households' income and purchasing power ;
- Public finances.
For each category, are available :
- synthetic files displaying from the accounts the relevant information for economic analysis ,
- sometimes, one or two files displaying all the data available.
Documentation
Abbreviated methodology (pdf, 140 Ko )
Methodology - First estimate at 30 days (pdf, 112 Ko )