


 9 June 2016
2016- n° 149Employment increased again in Q1 2016 Payroll employment - 1st Quarter 2016
9 June 2016
2016- n° 149Employment increased again in Q1 2016 Payroll employment - 1st Quarter 2016
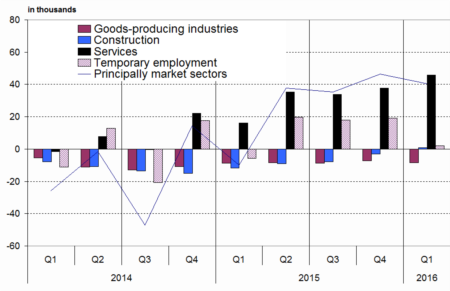
In Q1 2016, payroll employment in the non-farm market sectors continued to increase (+40,400 jobs, that is 0.3%, after +46,500 jobs in the previous quarter). Excluding temporary work, employment speeded up slightly (+38,400 jobs, i.e. +0.2%, after +27,500 jobs in Q4 2015). Year-on-year, the principally market sectors created 159,600 jobs (+1.0%).

Warnings: The introduction of the “Déclaration Sociale Nominative” (DSN) to replace the “bordereau récapitulatif des cotisations” (BRC) may affect transitorily the declarative behavior of businesses. During the ramp-up phase of the DSN, adjustments are made in the statistical processing chain of employment estimates to reflect these changes. These changes are likely to generate more revisions than usual to data. Furthermore, the temporary employment estimate for the first quarter 2016 is provisional and may be revised later.
Payroll employment in the market sector continued to increase
In Q1 2016, payroll employment in the non-farm market sectors continued to increase (+40,400 jobs, that is 0.3%, after +46,500 jobs in the previous quarter). Excluding temporary work, employment speeded up slightly (+38,400 jobs, i.e. +0.2%, after +27,500 jobs in Q4 2015). Year-on-year, the principally market sectors created 159,600 jobs (+1.0%).
Employment in industry declined again but edged up straighted in construction
In Q1 2016, employment continued to decline in industry (−8,400 jobs, that is −0.3%) at a similar pace than in the previous quarter (–7,200 jobs, that is −0.2%). By contrast, employment in construction recovered slightly (+800, that is +0.1%, after –2, 900 in the previous quarter).
Year-on-year, industry lost 32,500 jobs (−1.0%) whereas construction shed 19,000 jobs (−1.4%).
Job creation remained dynamic in services, despite the slowdown in temporary employment
Temporary workers are recorded in services, regardless of the sector in which they carry out their mission effectively. Temporary employment slowed sharply in Q1 2016 (+2,000 jobs, that is +0.3%, after +19,000 jobs in Q4 2015). At the same time, employment in services excluding temporary work accelerated (+45,900 jobs, i.e. 0.4 %, after +37,700 in Q4 2015).
Overall, the pace of job creations remained dynamic in the market services sector (+47,900 jobs, that is +0.4%, after +56,700 in the previous quarter, i.e. +0,5%).
Year-on-year, temporary employment was very buoyant (+58,400 jobs, i.e. +11.0%) and the market services sector as a whole created 211,100 jobs (+1.9%)
tableautableau_1 – Payroll employment change in the competitive sector : thousands …
| Change in 3 months | Change in 1 year | Level | ||
|---|---|---|---|---|
| 2015 | 2015 | 2015 | 2015 | |
| Q3 | Q4 | Q4 | Q4 | |
| Principally market sectors | 46,5 | 40,4 | 159,6 | 16 021,1 |
| Goods-producing industries excl. Construction | –7,2 | –8,4 | –32,5 | 3 117,1 |
| Manufacturing | –6,1 | –7,3 | –30,2 | 2 749,8 |
| Construction | –2,9 | 0,8 | –19,0 | 1 318,5 |
| Services | 56,7 | 47,9 | 211,1 | 11 585,4 |
| of which : Temporary employment | 19,0 | 2,0 | 58,4 | 588,2 |
| Principally non-market sectors (*) | 8,3 | 8,4 | 27,4 | 2 024,3 |
| Total competitive sector (*) | 54,8 | 48,8 | 187,0 | 18 045,4 |
tableautableau_2 – ... Percentage
| Change in 3 months | Change in 1 year | ||
|---|---|---|---|
| 2015 | 2016 | 2016 | |
| Q4 | Q1 | Q1 | |
| Principally market sectors | 0,3 | 0,3 | 1,0 |
| Goods-producing industries excl. Construction | –0,2 | –0,3 | –1,0 |
| Manufacturing | –0,2 | –0,3 | –1,1 |
| Construction | –0,2 | 0,1 | –1,4 |
| Services | 0,5 | 0,4 | 1,9 |
| of which : Temporary employment | 3,4 | 0,3 | 11,0 |
| Principally non-market sectors (*) | 0,4 | 0,4 | 1,4 |
| Total competitive sector (*) | 0,3 | 0,3 | 1,0 |
- (*) Excl. Agriculture and public employees in non-markets sectors (administration, health, education and social activity) ; na : not availablevolution of principally market sectors
- Source : INSEE
graphiqueGraph2 – Evolution of principally market sectors
Revisions
The estimate of payroll employment in the principally market sectors in Q4 2015 is revised upwards by 14,700 jobs. That for Q1 2016 is revised upwards by 16,000 jobs compared to the Flash estimate released on 13 May 2016.
These revisions result from changes to seasonal adjustment models (see abbreviated methodological note) and from adjustments in the statistical processing chain because of the ramp up of the DSN (see warnings).
tableautableau_4 – Payroll employment change in the competitive sector (*)
| Code | Change in 3 months | Change in 1 year | Level | ||
|---|---|---|---|---|---|
| Naf | 2015 | 2016 | 2016 | 2016 | |
| rev.2 | Q4 | Q1 | Q1 | Q1 | |
| DE | Electricity, gas, steam, and air conditioning supply ; water supply, sewerage, waste management and remediation activities | –1,1 | –1,1 | –2,3 | 367,3 |
| C1 | Manufacture of food products beverage and tobacco products | 2,0 | 1,7 | 4,7 | 553,6 |
| C2 | Manufacture of coke, and refined petroleum products | –0,1 | 0,0 | –0,2 | 9,4 |
| C3 | Manufacture of computer, electronic and electrical products; manufacture of machinery and equipment | –3,0 | –3,9 | –11,3 | 419,8 |
| C4 | Manufacture of transport equipment | –0,6 | –1,1 | –4,5 | 345,7 |
| C5 | Other manufacturing | –4,4 | –3,9 | –18,9 | 1421,3 |
| FZ | Construction | –2,9 | 0,8 | –19,0 | 1318,5 |
| GZ | Wholesale and retail trade ; repair of motor vehicles and motorcycles | 7,4 | 8,3 | 30,9 | 3034,8 |
| HZ | Transportation and storage | 0,9 | 2,4 | 6,0 | 1343,9 |
| IZ | Accommodation and food service activities | 5,1 | 15,2 | 34,1 | 1026,3 |
| JZ | Information and communication | 3,6 | 1,7 | 8,7 | 715,4 |
| KZ | Financial and insurance activities | –1,8 | 1,6 | 6,6 | 855,0 |
| LZ | Real estate activities | 1,1 | 1,7 | 3,7 | 235,9 |
| MN | Professional, scientific and technical activities; administrative and support service activities | 42,9 | 15,7 | 115,7 | 3086,6 |
| of which : Temporary employment | 19,0 | 2,0 | 58,4 | 588,2 | |
| OQ | Public administration and defence ; compulsory social security; education; human health and social work activities | 8,3 | 8,4 | 27,4 | 2024,3 |
| RU | Other service activities | –2,5 | 1,1 | 5,3 | 1287,5 |
- (*) Excl. Agriculture and public employees in non-markets sectors (administration, health, education and social activity)
- Source : INSEE
Documentation
Methodology (pdf,135 Ko)
Pour en savoir plus
