


 31 May 2016
2016- n° 145In March 2016, the turnover fell slightly in the manufacturing industry (–0.2%) Turnover in industry and construction - March 2016
31 May 2016
2016- n° 145In March 2016, the turnover fell slightly in the manufacturing industry (–0.2%) Turnover in industry and construction - March 2016
In March 2016, the turnover fell back slightly in the manufacturing industry (-0.2%) after a virtual stability in February (+0.1%). Exports declined more substantially (-0.6%).

Every index in this issue is in value (tax excluded), seasonally and working day adjusted. The commentary shows variations of subsections by decreasing contribution. The contribution of a subsection depends on the extent of the change and on its weight.
In March 2016, the turnover fell back slightly in the manufacturing industry (−0.2%) after a virtual stability in February (+0.1%). Exports declined more substantially (−0.6%).
In the industry as a whole, the turnover decreased slightly (–0.2%) after a rise in February (+0.7%), owing to a drop in the mining and quarrying; energy; water supply; waste management sector (−0.5%, after +3.6% in February).
Fall over the first quarter (–1.1%)
Over the first quarter of 2016, the turnover went down in the manufacturing industry as well as in the industry as a whole (−1.1%) compared to the last quarter of 2015. It dropped dramatically in the manufacture of coke and refined petroleum products (−10.3%), and, more moderately, in the manufacture of transport equipment (−2.7%). It fell too in other manufacturing (−0.5%), mainly in the manufacture of chemicals and chemical products (−0.9%) and in the manufacture of rubber, plastics and non-metallic mineral products (−1.0%). Conversely, it rose over the first quarter in the manufacture of food products and beverages (+0.5%). It remained virtually stable in the capital goods industry (+0.1%).
Decline compared to the previous year (−0.6%)
In the manufacturing industry, the turnover declined in the first quarter of 2016, compared to the same quarter of 2015 (−0.6%, y-o-y).
Over this period, the turnover plummeted in the manufacture of coke and refined petroleum products (−23.3%) as a result of the fall in producer prices. On the contrary, it went up in the manufacture of transport equipment (+1.7%), in the manufacture of food products and beverages (+1.1%) and in the capital goods industry (+1.2%). It levelled off in other manufacturing (+0.1%).
In the industry as a whole, the turnover declined more (−0.7%) due to a fall in the mining and quarrying, energy, etc. (−1.6%).
graphiqueIRgraph3 – Turnover in manufacturing industry

- Source: INSEE
graphiqueIRGraph4 – Turnover in manufacturing industry by sector
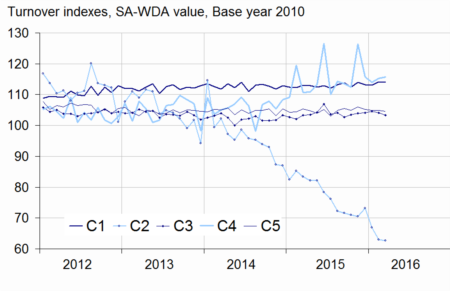
- Source: INSEE
tableauIRtab5 – Variation of the turnover in industry and construction
| Change in % | |||||
|---|---|---|---|---|---|
| NA: A 10, (A 17) | Weight** | Mar./ Feb. | Feb./ Jan. | q-o-q (1) | y-o-y (2) |
| BE: INDUSTRY | 10000 | –0.2 | 0.7 | –1.1 | –0.7 |
| CZ: MANUFACTURING INDUSTRY | 8346 | –0.2 | 0.1 | –1.1 | –0.6 |
| Of which Exports | 2677 | –0.6 | –0.2 | –2.8 | –1.9 |
| (C1): Manufacture of food products and beverages | 1685 | –0.2 | 0.9 | 0.5 | 1.1 |
| (C2): Manufacture of coke and refined petroleum products | 561 | –0.4 | –6.0 | –10.3 | –23.3 |
| (C3): Capital goods industry | 953 | –0.7 | –0.5 | 0.1 | 1.2 |
| (C4): Manufacture of transport equipment | 1265 | 0.3 | 1.2 | –2.7 | 1.7 |
| (C5): Other manufacturing | 3881 | –0.2 | 0.0 | –0.5 | 0.1 |
| DE: Mining and quarrying; energy; water supply; waste management | 1654 | –0.5 | 3.6 | –1.3 | –1.6 |
| FZ: CONSTRUCTION | 10000 | –1.3 | 1.2 | –0.1 | 0.3 |
- ** 10000=B...E and F
- (1) Quarter-on-quarter: last three months / previous three months
- (2) Year-on-year: last three months / same three months of previous year
- The codes correspond to different levels of aggregation of the NACE classification.
- Source: INSEE
Further decline in equipments (–0.7%)
The turnover in the capital goods industry declined again in March (−0.7%, after −0.5% in February), only due to the manufacture of machinery and equipment n.e.c. (−2.6%). Conversely, the turnover grew in the manufacture of computer, electronic and optical products (+1.0%) and in the manufacture of electrical equipment (+0.5%).
Slight fall in other manufacturing (–0.2%)
The turnover in other manufacturing decreased slightly in March (−0.2%). It fell back in other manufacturing: industries (−0.7%), in the manufacture of rubber, plastics and non-metallic mineral products (−0.7%) and in that of wood and paper products (−0.9%). However, it was stable in the manufacture of chemicals and chemical products and it rebounded in the manufacture of basic metals and fabricated metal products (+0.7%).
Slight growth in transport equipments (+0.3%)
The turnover in the manufacture of transport equipment grew slightly in March (+0.3%, after +1.2% in February). It picked up in the manufacture of other transport equipment (+1.5%, after −2.0%) while it slipped back in the manufacture of motor vehicles, trailers and semi-trailers (−0.9%, after +5.0% in February).
Slight downturn in food products and beverages (−0.2%)
The turnover edged in the manufacture of food products and beverages (−0.2%) after a rise in February (+0.9%).
Moderate fall in coke and refined petroleum products (−0.4%)
In March, the turnover fell once again in the manufacture of coke and refined petroleum products (−0.4%), albeit more slowly than in the two previous months (−6.0% in February and −8.5% in January).
Revisions: +0.1 points in February in the manufacturing industry
In the manufacturing industry, the evolution of the turnover in February 2016 was revised upwards, at +0.1% instead of 0.0% published previously. It was unchanged in the industry.
tableauIRtab8 – Indexes of turnover in industry and construction
| Change in % | |||||
|---|---|---|---|---|---|
| NA: A10, (A17), [A38 or A64] | Weight* | Mar. 2016 | Mar./ Feb. | Feb./ Jan. | q-o-q (2) |
| BE: INDUSTRY | 10000 | 106.5 | –0.2 | 0.7 | –1.1 |
| CZ: MANUFACTURING INDUSTRY | 8346 | 105.2 | –0.2 | 0.1 | –1.1 |
| of which Exports | 2677 | 109.3 | –0.6 | –0.2 | –2.8 |
| (C1): Man. of food products and beverages | 1685 | 114.0 | –0.2 | 0.9 | 0.5 |
| of which Exports | 285 | 116.1 | –1.8 | 1.7 | 0.6 |
| (C2): Man. of coke and refined petroleum products | 561 | 62.7 | –0.4 | –6.0 | –10.3 |
| (C3): Capital goods | 953 | 103.3 | –0.7 | –0.5 | 0.1 |
| of which Exports | 469 | 100.4 | –2.2 | –0.4 | –0.7 |
| [CI] Man. of computer, electronic and optical products | 306 | 101.4 | 1.0 | –1.6 | 0.7 |
| [CJ] Man. of electrical equipment | 245 | 98.3 | 0.5 | –0.2 | –0.4 |
| [CK] Man. of machinery and equipment n.e.c. (1) | 402 | 107.8 | –2.6 | 0.1 | –0.1 |
| (C4): Man. of transport equipment | 1265 | 115.7 | 0.3 | 1.2 | –2.7 |
| of which Exports | 617 | 123.9 | 1.7 | –0.3 | –4.9 |
| [CL1] Man. of motor vehicles, trailers and semi-trailers | 702 | 99.0 | –0.9 | 5.0 | –3.0 |
| [CL2] Man. of other transport equipment | 562 | 136.6 | 1.5 | –2.0 | –2.4 |
| (C5): Other manufacturing | 3881 | 104.6 | –0.2 | 0.0 | –0.5 |
| of which Exports | 1237 | 106.6 | –1.0 | –0.5 | –2.3 |
| [CB] Man. of textiles, wearing apparel, leather and related products | 188 | 108.6 | 0.5 | –0.2 | –0.7 |
| [CC] Man. of wood and paper products; printing and reproduction of recorded media | 436 | 96.8 | –0.9 | 0.0 | –0.9 |
| [CE] Man. of chemicals and chemical products | 745 | 100.0 | 0.0 | –1.3 | –0.9 |
| [CF] Man. of basic pharmaceutical products and pharmaceutical preparations | 304 | 108.3 | –0.2 | 1.2 | –1.1 |
| [CG] Man. of rubber and plastics products, and other non-metallic mineral products | 629 | 103.2 | –0.7 | 1.2 | –1.0 |
| [CH] Man. of basic metals and fabricated metal products, except machinery and equipment | 926 | 102.0 | 0.7 | –1.2 | –0.1 |
| [CM] Other manufacturing; repair and installation of machinery and equipment | 653 | 117.3 | –0.7 | 1.0 | 0.2 |
| DE: Mining and quarrying; energy, water supply, sewerage, waste management | 1654 | 113.2 | –0.5 | 3.6 | –1.3 |
| [BZ] Mining and quarrying | 70 | 90.4 | –1.0 | –4.0 | –0.9 |
| [DZ] Electricity, gas, steam and air-conditioning supply | 1205 | 115.3 | –0.2 | 3.7 | –1.6 |
| [EZ] Water supply; sewerage, waste management and remediation | 379 | 110.6 | –1.5 | 4.5 | –0.2 |
| FZ: CONSTRUCTION | 10000 | 103.1 | –1.3 | 1.2 | –0.1 |
- ** 10000=B...E and F
- (1) n.e.c.: not elsewhere classified
- (2) Quarter-on-quarter: last three months / previous three months
- Source: INSEE
tableauIRtab7 – Measure of variations' revisions
| Feb./ Jan. | Jan./ Dec. | Dec./ Nov. | Q4 2014/ Q3 2014 | 2014/ 2013 | |
|---|---|---|---|---|---|
| Industry (BE) | 0.01 | –0.16 | 0.10 | 0.08 | –0.01 |
| raw serie | 0.07 | –0.13 | 0.19 | 0.13 | –0.01 |
| SA-WDA coeff. | –0.06 | –0.02 | –0.10 | –0.05 | 0.00 |
| Manufacturing industry (CZ) | 0.03 | –0.19 | 0.10 | 0.11 | –0.02 |
| raw serie | 0.23 | –0.17 | 0.23 | 0.15 | –0.02 |
| SA-WDA coeff. | –0.20 | –0.02 | –0.12 | –0.04 | 0.00 |
- How to read it: in the manufacturing industry, the SA-WDA evolution between January and February 2016 was revised by +0.03 points: +0.23 points were due to the raw serie's revision and −0.20 points to the new calculation of the SA-WDA.
- Source: INSEE
Documentation
Methodology (pdf,140 Ko)
Pour en savoir plus
Time series : Turnover indices (VAT)
