


 31 March 2016
2016- n° 90Overall producer prices of agricultural products decreased by 0.8% in February 2016 Indices of agricultural prices - février 2016
31 March 2016
2016- n° 90Overall producer prices of agricultural products decreased by 0.8% in February 2016 Indices of agricultural prices - février 2016
In February 2016, overall producer prices of agricultural products fell again compared to last month (−0.8 after −1.1%) Over one year, they dropped by 2.3%.
In February 2016, overall producer prices of agricultural products fell again compared to last month (−0.8 after −1.1%) Over one year, they dropped by 2.3%.
Sharp falls in cereals and oleaginous prices
Cereal prices have tumbled for three months (−14,7 % compared to November 2015) due to the abundant world supply And forecast of significant harvests in the Northern hemisphere.
graphiquecereal – Producer prices of cereals
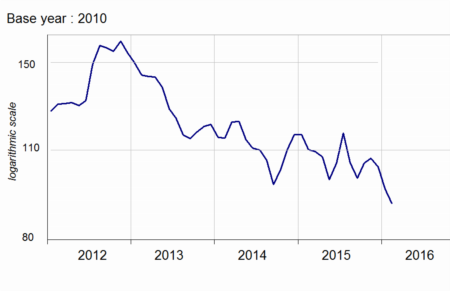
- Source: INSEE
Oleaginous prices have slumped for three months (−9,1% compared to November 2015) reflecting the decrease in Chinese importations and the significant fall in oil prices that reduced the interest of hydrocarbon substitution by oleaginous.
Surge in potatoe prices, near stability in fruit prices and drop in vegetable prices.
Potatoe prices doubled in February over one year. The 2015 crop reached its long-term average whereas the previous one was exceptional.
Fresh fruit prices were virtually stable over one year. Walnuts and kiwis prices declined while apples became a little more expensive, as this fruit was sold easily through exportations.
Fresh vegetable prices plummeted y-o-y (−17.3%). The mild temperatures hastened the harvests and improved the yields, noticeably for salads and cauliflowers. Chicory prices also fell back, as a result of the competition of salad.
graphiquevegetable – Producer prices of fresh vegetables
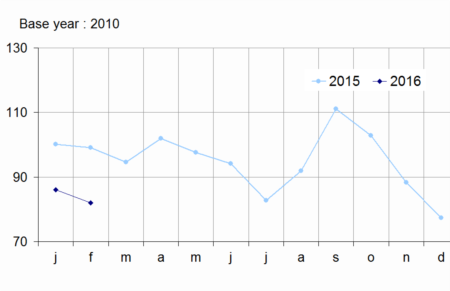
- Source: SSP (ministry in charge of agriculture)
Drop in animal prices and tumble in milk price
On a seasonaly adjusted basis animal prices decreased in February 2016 (−0.6% compared to last month). The European competition and the Russian embargo kept on weighing on pig prices (−1.3%), that were already low.
graphiquepig – Producer prices of pigs and large cattle
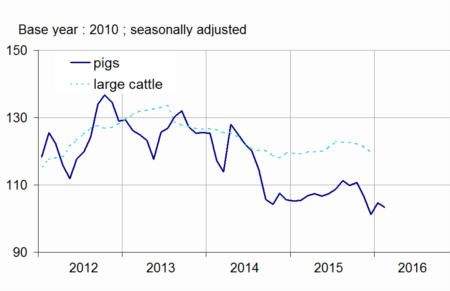
- Source: INSEE
Cow milk prices lost 8.4% over the last three months : since the end of the quotas, the Northern Europe increased its production of cow milk while, on the demand side, the Russian outlet remained suspended and the Chinese demand slowed down.
Egg price picked up a little this month (+0.5%), after falling sharply in January.
tableauTab1 – Indices of producer prices of agricultural products (IPPAP)
| Variation as % over | |||||
|---|---|---|---|---|---|
| Weights | Feb. 2016 | a month | 3 month | a year | |
| raw | Seasonnaly adjusted | raw | |||
| Agricultural goods output | 1000 | 108.5 | –0.8 | –4.6 | –2.3 |
| excluding fruits and vegetables | 900 | 110.0 | –0.7 | –4.4 | –1.7 |
| Crop output (excluding fruits and vegetables) | 505 | 113.4 | –1.0 | –4.6 | –0.8 |
| Cereals | 188 | 91.1 | –4.9 | –14.7 | –17.3 |
| of which soft wheat | 112 | 86.6 | –6.0 | –17.0 | –20.2 |
| grain maize | 41 | 87.6 | –3.5 | –11.4 | –3.4 |
| Potatoes | 26 | 180.8 | /// | /// | +97.4 |
| Wines | 177 | 133.8 | +1.9 | +2.2 | +3.9 |
| Protected designation of origin | 84 | 142.8 | +3.2 | +4.2 | +7.4 |
| other wines | 23 | 147.4 | +1.3 | –0.1 | –0.9 |
| Oleaginous | 49 | 95.1 | –3.0 | –9.1 | –2.1 |
| Horticultural products | 30 | 110.9 | –1.4 | –2.9 | 0.0 |
| Other crop products | 36 | 108.1 | –0.1 | +0.7 | 0.0 |
| Fruits and vegetables (1) | 100 | 94.2 | /// | /// | –8.8 |
| Fresh vegetables | 53 | 82.0 | /// | /// | −17.3 |
| Fresh fruits | 35 | 104.6 | /// | /// | –0.2 |
| Animal output | 395 | 105.7 | –0.4 | –4.1 | –2.8 |
| Animals | 234 | 110.1 | –0.6 | –1.7 | –0.8 |
| of which large cattle | 96 | 116.3 | –0.8 | –3.1 | –1.0 |
| calves | 26 | 114.0 | +1.1 | +4.7 | +2.2 |
| pigs | 54 | 96.4 | –1.3 | –3.2 | –2.6 |
| sheep | 10 | 111.5 | –2.4 | –0.9 | –6.4 |
| poultry | 46 | 111.0 | –0.2 | –0.6 | +1.7 |
| of which chicken | 28 | 110.3 | –0.4 | –1.3 | +0.9 |
| Milk | 147 | 97.8 | /// | –7.8 | –5.9 |
| of which cow milk (2) | 137 | 96.9 | /// | –8.4 | –6.4 |
| Eggs | 15 | 114.3 | +0.5 | –8.9 | –6.4 |
- (1) Including vegetables for industry.
- (2)The seasonnaly adjusted cow milk price indice is not yet known and therefore is carried forward to its January level
- Sources: INSEE, SSP (ministry in charge of agriculture)
Purchase prices of means of production virtually stable in February
In February 2016, intermediate consumptions prices decreased again compared to the previous month (−0.4 % after −-0.7%). Animal feed prices kept declining (−0.9 %) while prices of energy and fertiliser stabilized.
However, energy prices remained far inferior to its level one year before (−18.8%), as well as, albeit to a lesser extent, fertiliser prices (−6.0%). Capital goods prices increased by 0.4% over one month.
graphiquemeans – Purchase prices of the means of agricultural production
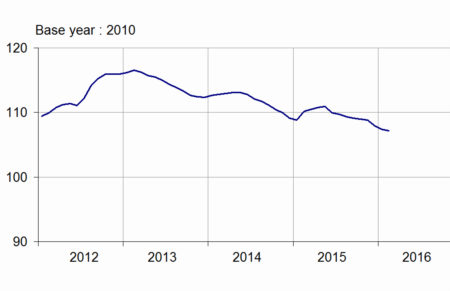
- Sources: INSEE, SSP (ministry in charge of agriculture)
tableauTab2 – Indices of purchase prices of the means of agricultural production (IPAMPA)
| Weights | Feb. 2016 | variation as % over | |||
|---|---|---|---|---|---|
| a month | 3 month | a year | |||
| Total input | 1000 | 107.2 | –0.2 | –1.5 | –2.7 |
| Intermediate consumptions | 764 | 107.3 | –0.4 | –2.1 | –3.8 |
| Energy | 100 | 83.6 | 0.0 | –11.4 | –18.8 |
| Seeds | 57 | 108.7 | –0.1 | –1.0 | +0.1 |
| Fertilisers and soil improvers | 92 | 114.1 | –0.1 | –1.6 | –6.1 |
| Plant protection products | 78 | 99.7 | –0.4 | –0.9 | –0.3 |
| Animal feed | 205 | 114.1 | –0.9 | –1.8 | –3.4 |
| Veterinary expenses | 43 | 116.3 | –0.1 | +1.1 | +2.4 |
| Small equipment and tools | 17 | 109.5 | –0.4 | –0.4 | +1.7 |
| Maintenance of materials | 67 | 113.5 | 0.0 | +0.1 | +0.6 |
| Maintenance of buildings | 9 | 106.6 | 0.0 | +0.1 | –0.1 |
| Other goods and services | 97 | 101.8 | 0.0 | 0.0 | +0.6 |
| Goods and services contributing to investment | 236 | 107.2 | +0.4 | +0.6 | +0.8 |
| Material | 186 | 108.4 | +0.4 | +0.8 | +1.4 |
| Tractors | 79 | 108.9 | +0.7 | +1.5 | +2.3 |
| Machinery and plant for cultivation | 36 | 110.6 | +0.4 | +1.2 | +1.1 |
| Machinery and plant for harvesting | 42 | 108.1 | +0.1 | +0.2 | +1.2 |
| Utility vehicles | 18 | 104.6 | 0.0 | –0.5 | 0.0 |
| Buildings | 50 | 102.4 | 0.0 | –0.8 | –1.7 |
- (1) The repayment of the domestic tax on energy products (TICPE) benefiting farmers has been applied in advance for the year 2016
- Sources: INSEE, SSP (ministry in charge of agriculture)
Documentation
Methodology (pdf,122 Ko)
Pour en savoir plus
Time series : Indices of agricultural prices
