


 26 February 2016
2016- n° 59Overall producer prices of agricultural products slid by 1.1% in January Indices of agricultural prices - January 2016
26 February 2016
2016- n° 59Overall producer prices of agricultural products slid by 1.1% in January Indices of agricultural prices - January 2016
In January, overall producer prices agricultural products fell by 1.1% compared to December, and by 1.7% over one year.

Warning : The seasonal adjustment of the seasonal series of producer price index have been reestimated including the year 2015
In January, overall producer prices agricultural products fell by 1.1% compared to December, and by 1.7% over one year.
Cereals and oleaginous prices tumbled
Cereal prices plunged in January (−7.4%) due to the abundance of the global supply. Soft wheat price declined by 8.5% over three months. Moreover, barley and corn where a little less incorporated into animal feed in favour of feed wheat, less expensive. Regarding corn, the vacancy in poultry houses in the South-West of France, after the epidemy of avian flue, limited also the demand.
graphiquecereal – Producer prices of cereals
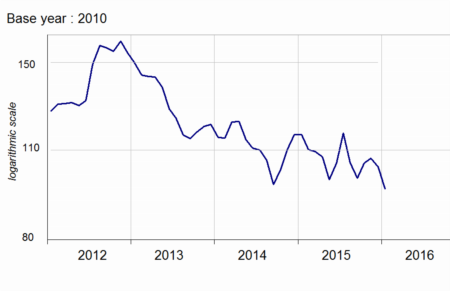
- Source: Insee
Oleaginous prices decreased significantly in January (−5.0%). Oil price drove rape price downwards: the drop in hydrocarbon prices reduced the interest of their substitution by the oleaginous.
Surge in potato prices, stability for fruits and drop in vegetable prices.
Potatoe prices almost doubled y-o-y. The 2015 crop reached its long-term average whereas the previous one was exceptional.
Fresh fruits prices faltered in January y-o-y (−1.5%). Kiwi and walnut prices decreased. Nevertheless, Corsican clementine price jumped as the production was less abundant in the previous years.
graphiquevegetable – Producer prices of fresh vegetables
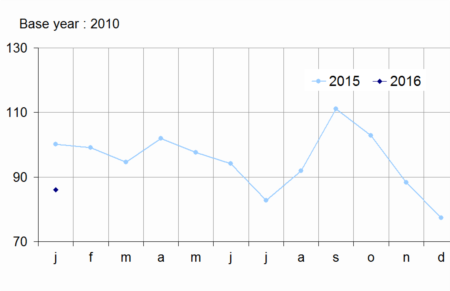
Fresh vegetables prices fell y-o-y (-14.1 %). The mild wheather at the end of the year accelerated the harvests and improved the yields, noticeably for lettuces and cauliflowers.
graphiquepig – Producer prices of pigs and large cattle
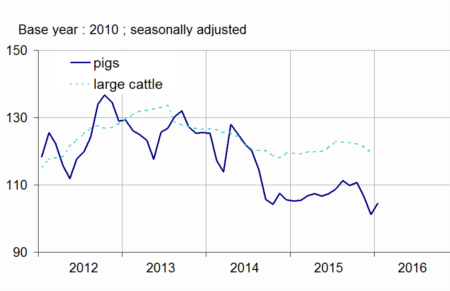
Overall drop in animal prices
On a seasonally adjusted basis, prices of animals increased a little in January (+0.4%). However pig price declined over three months (−5.5%) due to European competition, whereas the exporters were still deprived of the Russian outlet, subject to embargo. Milk price stabilized at a low level: since the end of the quotas Northern Europe increased its production of cow milk while, on the demand side, the Russian outlet was suspended and the Chinise demand slowed down. Egg prices plummeted (−9.6%) in relation with the excessive supply : severlal countries had closed their borders to the French poultry following the avian flue episode.
tableauTab1 – Indices of producer prices of agricultural products (IPPAP)
| Weights | Jan. 2016 | Variation as % over | |||
|---|---|---|---|---|---|
| a month | 3 months | a year | |||
| raw | Seasonnaly adjusted | raw | |||
| Agricultural goods output | 1000 | 110.1 | –1.1 | –3.4 | –1.7 |
| excluding fruits and vegetables | 900 | 111.7 | –1.5 | –2.4 | –1.1 |
| Crop output (excluding fruits and vegetables) | 505 | 114.4 | –2.5 | –3.1 | –1.7 |
| Cereals | 188 | 95.8 | –7.4 | –8.7 | –17.5 |
| of which soft wheat | 112 | 92.1 | –8.1 | –8.5 | –20.0 |
| grain maize | 41 | 90.8 | –6.1 | –6.4 | –1.5 |
| Potatoes | 26 | 178.5 | /// | /// | +92.1 |
| Wines | 177 | 131.3 | +0.6 | +1.2 | +1.6 |
| Protected designation of origin | 84 | 138.4 | +1.2 | +3.1 | +3.5 |
| other wines | 23 | 145.7 | +0.3 | –2.5 | –1.8 |
| Oleaginous | 49 | 98.0 | –5.0 | –4.7 | +2.6 |
| Horticultural products | 30 | 110.0 | –1.3 | –2.5 | +1.3 |
| Other crop products | 36 | 108.2 | +0.5 | +1.2 | +1.7 |
| Fruits and vegetables (1) | 100 | 95.7 | /// | /// | –7.8 |
| Fresh vegetables | 53 | 86.1 | /// | /// | –14.1 |
| Fresh fruits | 35 | 104.1 | /// | /// | –1.5 |
| Animal output | 395 | 108.1 | –0.1 | –1.4 | –0.5 |
| Animals | 234 | 110.0 | +0.4 | –2.0 | –0.1 |
| of which large cattle | 96 | 116.3 | –1.0 | –2.9 | –0.3 |
| calves | 26 | 112.7 | +1.8 | +6.9 | +1.6 |
| pigs | 54 | 94.9 | +3.4 | –5.5 | –1.4 |
| sheep | 10 | 118.9 | +0.9 | –1.2 | –3.5 |
| poultry | 46 | 111.2 | +0.1 | –0.6 | +2.2 |
| of which chicken | 28 | 110.7 | –0.4 | –1.2 | +1.8 |
| Milk | 147 | 104.6 | /// | +0.3 | +0.2 |
| of which cow milk (2) | 137 | 103.9 | /// | +0.3 | +0.1 |
| Eggs | 15 | 113.8 | –9.6 | –5.5 | –9.8 |
- (1) Including vegetables for industry.
- (2)The price for Jan. is not yet known and therefore is estimated by carrying forward the seasonally adjusted price of December
- Sources: Insee, SSP (ministry in charge of agriculture)
Purchase prices of means of production slipped
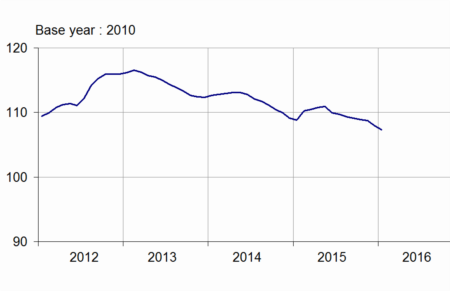
In January 2016, intermediate consumption prices fell compared to the previous month (−0,7 %) due to the decline in energy and fertiliser prices (resp. −3.3 % and −1.0 %). Over one year, they decreased too, by 2.0 %, with the same components, energy and fertilisers (resp. −10.6 % et −4.4 %). Capital goods prices were virtually stable (−0.1 %). Over one year, they went up by 0.7%.
graphiquemeans – Purchase prices of the means of agricultural production
tableauTab2 – Indices of purchase prices of the means of agricultural production (IPAMPA)
| Weights | Jan. 2016 | variation as % over | |||
|---|---|---|---|---|---|
| one month | 3 month | a year | |||
| Total input | 1000 | 107.3 | –0.6 | –1.5 | –1.4 |
| Intermediate consumptions | 764 | 107.6 | –0.7 | –2.0 | –2.0 |
| Energy | 100 | 84.0 | –3.3 | –11.1 | –10.6 |
| Seeds | 57 | 108.7 | –0.4 | –0.9 | +0.1 |
| Fertilisers and soil improvers | 92 | 114.3 | –1.0 | –1.8 | –4.4 |
| Plant protection products | 78 | 99.9 | –0.4 | –0.7 | +0.2 |
| Animal feed | 205 | 115.2 | –0.6 | –1.5 | –1.7 |
| Veterinary expenses | 43 | 116.1 | +1.0 | +0.8 | +2.1 |
| Small equipment and tools | 17 | 109.8 | –0.3 | –0.4 | +1.5 |
| Maintenance of materials | 67 | 112.4 | –1.1 | –1.0 | +0.1 |
| Maintenance of buildings | 9 | 106.5 | 0.0 | –0.1 | 0.0 |
| Other goods and services | 97 | 101.4 | +0.1 | +0.1 | +0.2 |
| Goods and services contributing to investment | 236 | 106.8 | –0.1 | +0.3 | +0.7 |
| Material | 186 | 107.8 | 0.0 | +0.5 | +1.0 |
| Tractors | 79 | 107.6 | 0.0 | +0.7 | +1.5 |
| Machinery and plant for cultivation | 36 | 110.5 | +0.6 | +1.0 | +1.3 |
| Machinery and plant for harvesting | 42 | 107.9 | –0.7 | 0.0 | +1.0 |
| Utility vehicles | 18 | 104.6 | +0.1 | +0.1 | –0.2 |
| Buildings | 50 | 103.2 | 0.0 | –0.2 | –0.8 |
- (1) The repayment of the domestic tax on energy products (TICPE) benefiting farmers has been applied in advance for the year 2016
- Sources: INSEE - SSP (ministry in charge of agriculture)
Documentation
Methodology (pdf,122 Ko)
Pour en savoir plus
Time series : Indices of agricultural prices
