


 26 February 2016
2016- n° 56In December 2015, the turnover fell back in the manufacturing industry (–1.1%) Turnover in industry and construction - December 2015
26 February 2016
2016- n° 56In December 2015, the turnover fell back in the manufacturing industry (–1.1%) Turnover in industry and construction - December 2015
In December 2015, the turnover fell back in the manufacturing industry (–1.1%, after +1.3% in November). Exports declined too (–0.6%, after +1.4%).

Warning: From the release of the indices for January 2016, on March 31, 2016, the turnover index series will be produced according to a new process, that improve their quality. The series will be recalculated over the period 1999-2015. Further information concerning these changes is available on the Web page of this index.
In December 2015, the turnover fell back in the manufacturing industry (–1.1%, after +1.3% in November). Exports declined too (–0.6%, after +1.4%).
In the industry as a whole, the turnover decreased as well (–1.0%, after +1.1%).
Decline over the fourth quarter (−0.4%)
Over the fourth quarter of 2015, the turnover went down by 0.4%, compared to the third quarter, both in the manufacturing industry and in the industry as a whole.
The turnover dropped considerably in the manufacture of coke and refined petroleum products (−5.2%). It fell, to a lesser extent, in the manufacture of food products and beverages (−1.1%), in the mining and quarrying; energy; water supply (–0.7%) and in the electrical and electronic equipment; machine equipment (−0.4%). On the contrary, the turnover grew in the manufacture of transport equipment (+0.9%). It remained virtually stable in other manufacturing (+0.1%).
Slight rise over the year (+0.2%)
In the manufacturing industry, the turnover went up slightly over the fourth quarter of 2015, compared to the fourth quarter of 2014 (+0.2%, y-o-y). It climbed more substantially in the industry as a whole (+0.6%) owed to a sharp rise in the mining and quarrying; energy; water supply; waste management (+2.2%).
Over this period, the turnover slumped in the manufacture of coke and refined petroleum products (−18.3%), due to the fall of producer prices. On the contrary, it improved sharply in the manufacture of transport equipment (+6.9%), and more moderately in the electrical and electronic equipment; machine equipment (+1.3%). It remained virtually stable in the manufacture of food products and beverages (–0.1%) and it levelled off in other manufacturing.
graphiqueIRgraph3 – Turnover in manufacturing industry
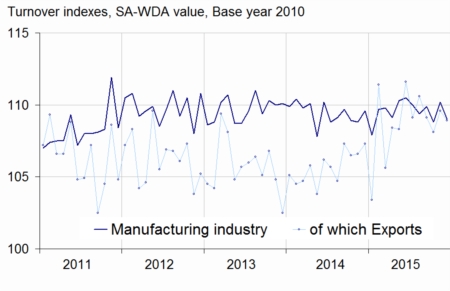
- Source: INSEE
tableauIRtab5 – Variation of the turnover in industry and construction
| Change in % | |||||
|---|---|---|---|---|---|
| NA: A 10, (A 17) | Weight** | Dec./ Nov. | Nov./ Oct. | q-o-q (1) | y-o-y (2) |
| BE: INDUSTRY | 10000 | –1.0 | 1.1 | –0.4 | 0.6 |
| CZ: MANUFACTURING INDUSTRY | 8373 | –1.1 | 1.3 | –0.4 | 0.2 |
| Of which Exports | 2731 | –0.6 | 1.4 | –0.7 | 1.9 |
| (C1): Manufacture of food products and beverages | 1647 | –1.6 | 1.7 | –1.1 | –0.1 |
| (C2): Manufacture of coke and refined petroleum products | 478 | –3.4 | 6.6 | –5.2 | –18.3 |
| (C3): Electrical and electronic equipment; machine equipment | 1005 | 0.3 | –0.7 | –0.4 | 1.3 |
| (C4): Manufacture of transport equipment | 1428 | –3.0 | 2.6 | 0.9 | 6.9 |
| (C5): Other manufacturing | 3815 | –0.2 | 0.6 | 0.1 | 0.0 |
| DE: Mining and quarrying; energy; water supply; waste management | 1627 | –0.2 | –0.1 | –0.7 | 2.2 |
| FZ: CONSTRUCTION | 10000 | –1.2 | 0.7 | 0.6 | –0.6 |
- ** 10000=B...E and F
- (1) Quarter-on-quarter: last three months / previous three months
- (2) Year-on-year: last three months / same three months of previous year
- The codes correspond to different levels of aggregation of the NACE classification.
Source: INSEE
graphiqueIRGraph4 – Turnover in manufacturing industry by sector
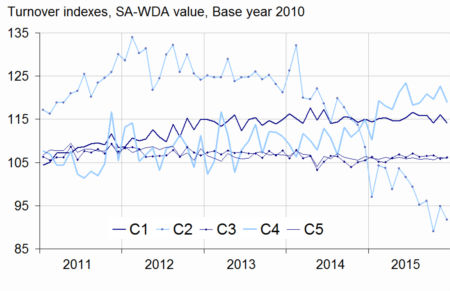
- Source: INSEE
Sharp downturn in transport equipment (–3.0%)
In December 2015, the turnover in the manufacture of transport equipment slipped back sharply (–3.0%, after +2.6% in November), in spite of a new rise in exports (+2.0%, after +3.3%). This decline was owed both to the manufacture of transport equipment (–2.7%) and to the manufacture of motor vehicles, trailers and semi-trailers (–3.4%, following a rise for four months in a row).
Drop in food products and beverages (–1.6%)
The turnover fell back in December in the manufacture of food products and beverages (–1.6%, after +1.7% in November).
Sharp decline in coke and refined petroleum products (–3.4%)
In December, the turnover dipped considerably in the manufacture of coke and refined petroleum products (–3.4%) after a dramatic growth in November (+6.6%).
Slight decrease in other manufacturing (–0.2%)
The turnover fell slightly in December in other manufacturing (–0.2%) after a rise in November (+0.6%). It declined mainly in the manufacture of basic metals and fabricated metal products (–1.6%), the manufacture of rubber and plastic products (–0.6%), and the manufacture of wood and paper products (–0.8%). On the other hand, it picked up sharply in the manufacture of basic pharmaceutical products and pharmaceutical preparations (+2.8%) and more moderately in the manufacture of chemicals and chemical products (+0.9%).
Slight rebound in equipments (+0.3%)
The turnover in the electrical and electronic equipment; machine equipment recovered slightly in December (+0.3%, after –0.7% in October). It bounced back in the manufacture of machinery and equipment n.e.c. (+1.3%). Conversely, it decreased again in the manufacture of computer, electronic and optical products (−0.7%) and in the manufacture of electrical equipment (–0.3%).
The rise in November is confirmed at +1.3%
In the manufacturing industry, the rise in November 2015 is confirmed at +1.3%. It has been revised upwards by 0.1 points in the industry as a whole (+1.1% instead of 1.0%).
tableauIRtab8 – Indexes of turnover in industry and construction
| Change in % | |||||
|---|---|---|---|---|---|
| Industries: | Weight* | Dec. 2015 | Dec./ Nov. | Nov./ Oct. | q-o-q (1) |
| BE: INDUSTRY | 10000 | 109.3 | –1.0 | 1.1 | –0.4 |
| CZ: MANUFACTURING INDUSTRY | 8373 | 109.0 | –1.1 | 1.3 | –0.4 |
| of which Exports | 2731 | 108.9 | –0.6 | 1.4 | –0.7 |
| (C1): Man. of food products and beverages | 1647 | 114.2 | –1.6 | 1.7 | –1.1 |
| of which Exports | 284 | 123.5 | –0.2 | 1.1 | –1.0 |
| (C2): Man. of coke and refined petroleum products | 478 | 91.7 | –3.4 | 6.6 | –5.2 |
| (C3): Electrical and electronic equipment; machine equipment | 1005 | 106.2 | 0.3 | –0.7 | –0.4 |
| of which Exports | 483 | 101.1 | –2.3 | –1.3 | –1.7 |
| [CI] Man. of computer, electronic and optical products | 269 | 102.8 | –0.7 | –0.4 | –0.4 |
| [CJ] Man. of electrical equipment | 302 | 99.7 | –0.3 | –0.6 | –0.5 |
| [CK] Man. of machinery and equipment n.e.c. | 434 | 112.8 | 1.3 | –0.8 | –0.4 |
| (C4): Man. of transport equipment | 1428 | 119.0 | –3.0 | 2.6 | 0.9 |
| of which Exports | 693 | 114.3 | 2.0 | 3.3 | 1.6 |
| [CL1] Man. of motor vehicles, trailers and semi-trailers | 689 | 98.3 | –3.4 | 2.0 | 4.0 |
| [CL2] Man. of other transport equipment | 739 | 138.7 | –2.7 | 3.0 | –1.0 |
| (C5): Other manufacturing | 3815 | 106.0 | –0.2 | 0.6 | 0.1 |
| of which Exports | 1213 | 106.0 | –1.9 | 1.4 | –1.8 |
| [CB] Man. of textiles, wearing apparel, leather and related products | 191 | 110.1 | 0.5 | 0.6 | 0.5 |
| [CC] Man. of wood and paper products; printing and reproduction of recorded media | 427 | 101.3 | –0.8 | 1.0 | 0.5 |
| [CE] Man. of chemicals and chemical products | 706 | 106.5 | 0.9 | –0.5 | –1.2 |
| [CF] Man. of basic pharmaceutical products and pharmaceutical preparations | 322 | 103.9 | 2.8 | –0.6 | –0.5 |
| [CG] Man. of rubber and plastics products, and other non-metallic mineral products | 620 | 102.5 | –0.6 | 0.8 | 0.9 |
| [CH] Man. of basic metals and fabricated metal products, except machinery and equipment | 900 | 104.1 | –1.6 | 1.5 | –0.2 |
| [CM] Other manufacturing; repair and installation of machinery and equipment | 649 | 114.2 | –0.3 | 0.2 | 0.6 |
| DE: Mining and quarrying; energy, water supply, sewerage, waste management | 1627 | 111.1 | –0.2 | –0.1 | –0.7 |
| [BZ] Mining and quarrying | 69 | 99.7 | –0.6 | 2.2 | 2.8 |
| [DZ] Electricity, gas, steam and air-conditioning supply | 1216 | 116.1 | 0.3 | –0.1 | –0.2 |
| [EZ] Water supply; sewerage, waste management and remediation | 342 | 96.0 | –1.7 | –0.3 | –3.6 |
| FZ: CONSTRUCTION | 10000 | 101.8 | –1.2 | 0.7 | 0.6 |
- ** 10000=B...E and F
- (1) Quarter-on-quarter: last three months / previous three months
- Source: INSEE
tableauIRtab7 – Measure of variations' revisions
| Nov./ Oct. | Oct./ Sep. | Sep./ Aug. | Q3 2015/ Q2 2015 | 2014/ 2013 | |
|---|---|---|---|---|---|
| Industry (BE) | 0.10 | 0.00 | 0.00 | –0.03 | –0.01 |
| raw serie | 0.36 | 0.00 | 0.00 | 0.00 | 0.00 |
| SA-WDA coeff. | –0.26 | 0.00 | 0.00 | –0.03 | –0.01 |
| Manufacturing industry (CZ) | 0.00 | 0.00 | 0.00 | –0.03 | –0.01 |
| raw serie | 0.09 | 0.00 | 0.00 | 0.00 | 0.00 |
| SA-WDA coeff. | –0.09 | 0.00 | 0.00 | –0.03 | –0.01 |
- How to read it: in the manufacturing industry, the SA-WDA evolution between October and November 2015 is not revised, the raw serie's revision (+0.09 points) is balanced by the new calculation of the SA-WDA (–0.09 points).
- Source: INSEE
Documentation
Methodology (pdf,140 Ko)
Pour en savoir plus
Time series : Turnover indices (VAT)
