


 14 January 2016
2016- n° 9Business start-ups increased in December 2015 Enterprise births - December 2015
14 January 2016
2016- n° 9Business start-ups increased in December 2015 Enterprise births - December 2015
In December 2015, the number of business births advanced again (+1.3%) following a drop in November (-0.7%, for all entreprises, seasonally and working-day adjusted). This slight growth was a result of the upsurge in self-managed micro-entrepreneurs' registrations (+3.3%).
In December 2015, the number of business births advanced again (+1.3%) following a drop in November (−0.7%, for all entreprises, seasonally and working-day adjusted). This slight growth was a result of the upsurge in self-managed micro-entrepreneurs' registrations (+3.3%).
–3.9% year-on-year (quarterly basis)
The raw amount of births added up in the last quarter of 2015 dropped by 3.9% compared to the same quarter one year before, because of the downturn in micro-entrepreneurs' registrations (–22.5%). Construction and trade were the sectors that most contributed to the overall fall1. On the opposite, distinctly more start-ups were created in the sector or transportation compared to the same months last year.
–4.7% year-on-year (twelve months basis)
The raw number of business start-ups totted up during the last twelve months slipped by 4.7% year-on-year. This was due to the sharp drop of self-managed micro-entrepreneurs' set-ups (–21.2%). On the other hand, sole proprietorships creations excluding self-managed micro-entrepreneurs shoot up (+27.6%) and companies' start-ups also increased (+3.8%).
Two business set-ups out of five are self-managed micro-entrepreneur's registrations
In December 2015, micro–entrepreneurs' registrations amounted to 42.6% of business set-ups over the twelve last months. One year before, the share was 51,4%.
tableautab0EN – Business set-ups distribution by type
| Oct. 2015 | Nov. 2015 | Dec. 2015 | |
|---|---|---|---|
| Companies | 32.2 | 32.5 | 32.8 |
| Sole proprietorships excluding self-managed micro-entrepreneurs | 23.6 | 24.2 | 24.7 |
| Self-managed micro-entrepreneurs | 44.2 | 43.3 | 42.6 |
- Source: INSEE (Sirene)

1 The contribution of a sector to the overall variation is the observed variation of this sector, weighted by the share of this sector in the total number of births.
graphiqueGraph1EN – Business start-ups (sa-wda *)
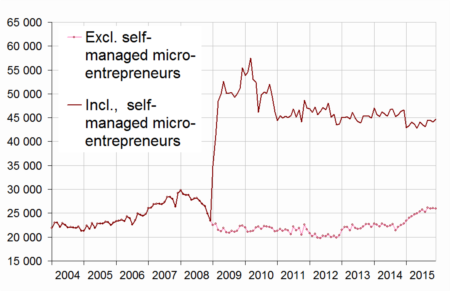
- * Seasonally and working-day adjusted data
- Source: INSEE (Sirene)
graphiqueGraph2EN – Trade and business support activities start-ups (sa-wda *)

- * Seasonally and working-day adjusted data
- Source : Insee, Sirene
graphiqueGraph3EN – Construction and real estate business set-ups (sa-wda *)

- * Seasonally and working-day adjusted data
- Source : Insee, Sirene
tableautab1EN – Business set-ups by month (sa-wda *)
| Sept. 2015 | Oct. 2015 | Nov. 2015 | Dec. 2015 | |
|---|---|---|---|---|
| Excl. self-managed micro-entrepreneurs | 26,132 | 25,986 | 26,028 | 25,978 |
| Variation [m-o-m] % | 3.6 | −0.6 | 0.2 | −0.2 |
| Incl. self-managed micro-entrepreneurs | 44,536 | 44,443 | 44,113 | 44,666 |
| Variation [m-o-m] % | 3.2 | −0.2 | −0.7 | 1.3 |
- * Seasonally and working-day adjusted data
- Source: INSEE (Sirene)
tableautab2EN – Business start-ups by type
| Moving total % change * | Moving total | Moving total | ||
|---|---|---|---|---|
| over 3 months | over 12 months | over the year 2015 | over the year 2014 | |
| Total | −3.9 | −4.7 | 525,091 | 550,794 |
| Companies | 5.8 | 3.8 | 171,998 | 165,764 |
| Sole proprietorships | −8.2 | −8.3 | 353,093 | 385,030 |
| Of which self-managed micro-entrepreneurs | −22.5 | −21.2 | 223,469 | 283,454 |
- * Total of business start-ups during the last 3 or 12 months compared with the same months a year earlier
- Source: INSEE (Sirene)
tableautab3EN – Number of business set-ups (incl. self-managed micro-enterprises)
| NA | Oct. 2015 | Nov. 2015 | Dec. 2015 | |
|---|---|---|---|---|
| Total | 44,443 | 44,113 | 44,666 | |
| Industry | BE | 2,014 | 2,024 | 1,981 |
| Of which Manufacturing | C | 1,761 | 1,753 | 1,731 |
| Construction | FZ | 5,155 | 5,084 | 5,060 |
| Wholesale and retail trade, Transport, Accommodation and Food and beverage activities | GI | 12,921 | 12,851 | 13,266 |
| Of which Trade | G | 8,129 | 8,065 | 8,074 |
| Of which Transportation and storage | H | 2,487 | 2,487 | 2,518 |
| Of which Accommodation and food service activities | I | 2,411 | 2,437 | 2,385 |
| Information and communication | JZ | 2,077 | 2,133 | 2,152 |
| Financial and insurance activities | KZ | 1,307 | 1,285 | 1,153 |
| Real estate activities | LZ | 1,581 | 1,503 | 1,491 |
| Business support activities | MN | 9,887 | 9,819 | 10,029 |
| Public administration and defence, education, human health and social work activities | OQ | 5,488 | 5,452 | 5,467 |
| Other services activities | RS | 4,015 | 3,963 | 4,066 |
- * Seasonally and working-day adjusted data
- Source: INSEE (Sirene)
tableautab3bisEN – Fluctuation in the number of business set-ups (incl. self-managed micro-entrepreneurs)
| NA | Dec. 15 / Nov. 15 | Moving total % change** | ||
|---|---|---|---|---|
| sa-wda * | over 3 months | over 12 months | ||
| Total | 1.3 | −3.9 | −4.7 | |
| Industry | BE | −2.1 | −16.7 | −15.3 |
| Of which Manufacturing | C | −1.3 | −19.3 | −17.7 |
| Construction | FZ | −0.5 | −16.1 | −16.6 |
| Wholesale and retail trade, Transport, Accommodation and Food and beverage activities | GI | 3.2 | −1.0 | −2.9 |
| Of which Trade | G | 0.1 | −9.7 | −9.3 |
| Of which Transportation and storage | H | 1.2 | 50.2 | 45.7 |
| Of which Accommodation and food service activities | I | −2.1 | −5.3 | −4.1 |
| Information and communication | JZ | 0.9 | −6.5 | −3.5 |
| Financial and insurance activities | KZ | −10.2 | 2.6 | 9.4 |
| Real estate activities | LZ | -0.8 | 15.8 | 7.2 |
| Business support activities | MN | 2.1 | 1.8 | −1.8 |
| Public administration and defence, education, human health and social work activities | OQ | 0.3 | −1.8 | 1.9 |
| Other services activities | RS | 2.6 | −11.4 | −9.1 |
- * Seasonally and working-day adjusted data
- ** Total of business start-ups during the last 3 or 12 months compared with the same months a year earlier
- Source: INSEE (Sirene)
Pour en savoir plus
Time series : Business demography
