


 15 March 2016
2016- n° 65In February 2016, oil prices edged up Prices of oil and raw material imports - February 2016
15 March 2016
2016- n° 65In February 2016, oil prices edged up Prices of oil and raw material imports - February 2016
In February 2016, the crude oil price in euros edged up (+5.4% after -18.0% in January). However, standing at €29.9 on average per barrel of Brent, this price was 41.3% lower than it was one year earlier (€51.0). Prices in euros of the other imported commodities recovered modestly (+0.8% after -2.6%). Prices of industrial raw materials increased (+2.8%), while those of raw food materials diminished (-2.4%).
In February 2016, the crude oil price in euros edged up (+5.4% after −18.0% in January). However, standing at €29.9 on average per barrel of Brent, this price was 41.3% lower than it was one year earlier (€51.0). Prices in euros of the other imported commodities recovered modestly (+0.8% after −2.6%). Prices of industrial raw materials increased (+2.8%), while those of raw food materials diminished (−2.4%).
Oil prices recovered a little
In February, the price of crude oil from the North Sea (Brent) in euros picked up (+5.4%) after a 33.7% downfall between October 2015 and January 2016. This recovery is most likely to be the result of the decision of the producing countries, in particular Saudi Arabia and Russia, to stabilise supply despite the high level of American stocks and the return of Iran to the global market. The crude price increase was more pronounced in dollars (+7.8% after −18.3%) because the euro appreciated slightly.
graphiqueG_petrole_ang – Oil (Brent)

- Source: INSEE
tableautabpetrole – Oil and petroleum products
| Prices | Change (%) | |||
|---|---|---|---|---|
| of last month | over the last month | over the last 3 months | over the last 12 months | |
| Brent in $ per barrel | 33.2 | 7.8 | –25.3 | –42.7 |
| Brent in € per barrel | 29.9 | 5.4 | –27.8 | –41.3 |
| Gasoline €/L | 0.23 | –10.7 | –27.1 | –38.6 |
| Gas Oil | 275.4 | 2.9 | –32.2 | –44.7 |
| Heavy fuel | 154.2 | –3.0 | –29.8 | –48.6 |
| Naphtha | 262.0 | –13.8 | –33.3 | –39.5 |
- Prices are in euros per tonne unless otherwise specified.
- Source: INSEE
Prices of industrial raw materials rallied slightly
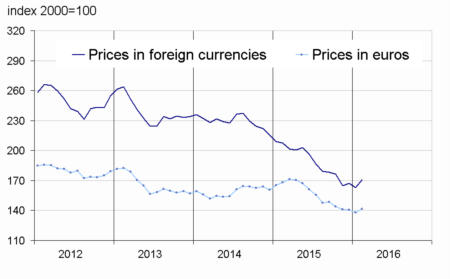
Prices of industrial raw materials in euros rallied (+2.8% after −2.3%). This upturn was driven up by the rebound in minerals prices (+4.2% after −1.9%). Prices of iron ore accelerated (+9.5% after +4.5%), as a result of a steel demand from China. Prices of non-ferrous metals picked up (+2.3% after −2.6%), foremost due to zinc (+10.4% after −0.1%). In effect, this metal output, used to galvanise steelwork, decreased with the depletion of veins and the shutdown of mines. Prices of precious metals accelerated (+5.1% after +0.4%), driven up by the price of gold (+7.1% after +3.0%) that was still acting as a safe haven.
Conversely, prices of agricultural raw materials decreased again (−2.1% after −2.8%; −13.7% year-on –year), in particular those of wood pulp (−2.4% after −1.4%) due to high output levels. Those of sawn softwood declined as well (−4.9% after −2.8%).
graphiqueG_indus_ang – Industrial raw materials
- Source: INSEE
Prices of raw food materials kept dropping
Prices of raw food materials in euros dipped again (−2.4% after −2.6%). The decline in sugar prices became more marked (−8.9% after −4.4%) as a result of yield records in Brazil. Prices of tropical foodstuffs decreased again (−4.3%), less than in January however (−95%). The downturn in cocoa prices weakened (−3.8% after −11.7%) but continued with the improved crop prospects in Ivory Coast and Ghana combined with a subdued demand. Prices of cereals remained roughly stable (+0.2% after −0.1%), the increase in rice prices offset the decrease in corn prices.
graphiqueG_alim_ang – Food

graphiqueG_ensemble_ang – Imported raw materials (excluding energy)
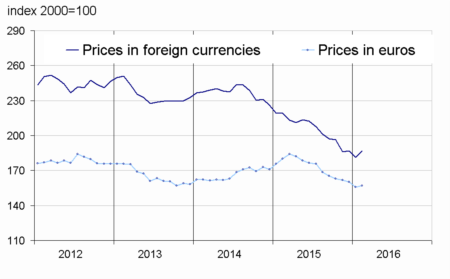
- Source: INSEE
tableautabmatprem – Imported raw materials (excluding energy) in euros
| Index | Changes (%) | |||
|---|---|---|---|---|
| of last month | over the last month | over the last 3 months | over the last 12 months | |
| Food total | 199.1 | –2.4 | –7.1 | –9.5 |
| Tropical foodstuffs | 195.1 | –4.3 | –14.5 | –5.7 |
| Oil seeds, vegetable oils | 209.7 | –0.3 | –7.9 | –13.6 |
| Cereals | 149.1 | 0.2 | –1.2 | –5.4 |
| Sugar | 134.4 | –8.9 | –13.6 | –6.1 |
| Beef meat | 162.4 | –4.1 | 5.6 | –11.2 |
| Industrial raw materials | 141.6 | 2.8 | 0.4 | –15.7 |
| Agricultural raw materials | 103.9 | –2.1 | –6.1 | –13.7 |
| Natural fibres | 116.0 | –4.7 | –6.3 | –0.8 |
| Natural rubber | 112.3 | 2.1 | –6.6 | –31.3 |
| Hides | 73.3 | –6.6 | –0.7 | –29.7 |
| Wood pulp | 96.9 | –2.4 | –6.8 | –10.4 |
| Tropical wood | 107.6 | –2.9 | –9.0 | –4.4 |
| Sawn softwood | 81.8 | –4.9 | –6.4 | –17.9 |
| Minerals | 161.5 | 4.2 | 2.1 | –16.8 |
| Iron ore | 308.3 | 9.5 | –3.3 | –24.6 |
| Non-ferrous metals | 135.9 | 2.3 | 2.0 | –16.7 |
| Precious metals | 222.6 | 5.1 | 2.8 | –11.2 |
| All commodities | 157.1 | 0.8 | –2.8 | –12.8 |
- Source: INSEE
Pour en savoir plus
Time series : Raw materials prices
