


 24 March 2016
2016- n° 76In March 2016, the business climate is almost unchanged in services Monthly survey of services - March 2016
24 March 2016
2016- n° 76In March 2016, the business climate is almost unchanged in services Monthly survey of services - March 2016
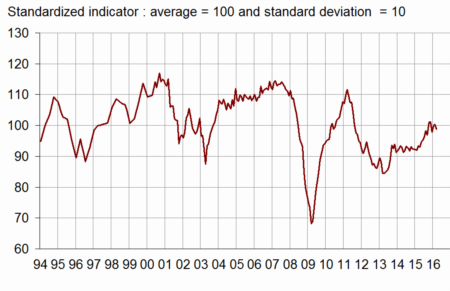
According to business managers surveyed in March 2016, the business climate in services is virtually stable. The business climate composite indicator has decreased by one point and has fallen back (99) slightly below its long-term average (100). The turning point indicator stays in the uncertainty area.
All services
According to business managers surveyed in March 2016, the business climate in services is virtually stable. The business climate composite indicator has decreased by one point and has fallen back (99) slightly below its long-term average (100). The turning point indicator stays in the uncertainty area.
graphiqueGraph1 – Business climate composite indicator
graphiquegraph_retourn – Turning point indicator
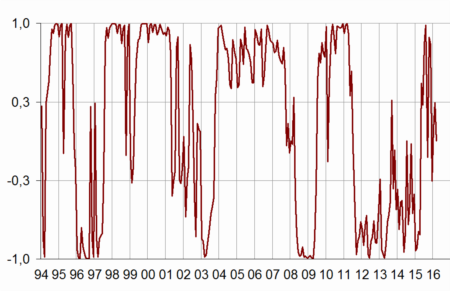
- Note: close to 1 (respectively -1), this indicator indicates a favourable short-term economic situation (respectively unfavourable). Between +0.3 and -0.3: uncertainty area.
The balance of opinion on the general outlook, which relates the assessment of business leaders over their whole sector, remains at its long-term average.
The balance on past activity is unchanged, slightly below its long-tem average. However, the balances on expected activity and demand have decreased; the balance on demand has fallen back just below its long-term average.
The balances on employment remain above their long-term average, particularly in temporary work agencies, even if the balance on expected employment has fallen back to its level of January.
The balances on past and expected investments are stable above their long-term average.
tableauTable_quarter – Economic outlook in the services sector
| Average* | Dec. 15 | Jan. 16 | Feb. 16 | March 16 | |
|---|---|---|---|---|---|
| Composite indicator | 100 | 98 | 100 | 100 | 99 |
| General outlook | –8 | –9 | –4 | –8 | –8 |
| Past activity | 2 | –1 | –2 | 0 | 0 |
| Expected activity | 2 | –2 | –1 | 0 | –2 |
| Expected demand | –1 | –4 | –1 | 1 | –2 |
| Past selling prices | –4 | –7 | –7 | –10 | –9 |
| Expected selling prices | –3 | –10 | –12 | –4 | –4 |
| Past employment | 3 | 11 | 11 | 7 | 9 |
| except temporary work agencies | 1 | 2 | 4 | 3 | 7 |
| Expected employment | 2 | 7 | 8 | 11 | 8 |
| except temporary work agencies | –1 | 2 | 0 | 2 | –1 |
| Investments | |||||
| Past investments | 1 | 7 | 5 | 6 | 6 |
| Expected investments | 1 | 7 | 6 | 3 | 3 |
- * Average of the balances of opinion since 1988
- Source: INSEE, business survey in services
Revisions
The business climate in services in February 2016 has been revised upward by one point since its first estimate, because of late businesses' answers that have been taken into account.
Road transport
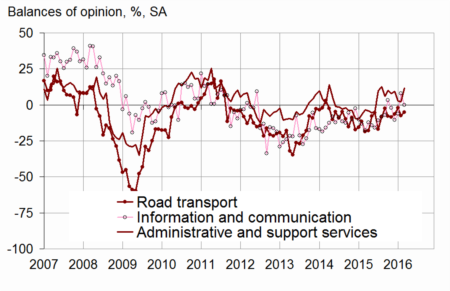
In road freight, the balances on activity and demand have increased. They are superior to their long-term average. The balances on employment are virtually stable, above their long-term average.
Accommodation and food services
In accommodation and food service activities, the balance on past activity has improved. However, the expectations on activity and demand have deteriorated. The corresponding balances have returned to their long-term average.
Information and communication
In information and communication, the balance on past activity has fallen back below its long-term average. The balances on expected activity and demand have decreased slightly ; the balance on expected demand stays close to its long-term average.
Real estate
In real estate, the balance on past activity has dropped significantly. The expectations on activity and demand have deteriorated too. Those balances have deviated further from their long-term average. The balance on past employment has recovered whereas the balance on expected employment has decreased again.
Professional, scientific and technical activities
In professional, scientific and technical activities, the balance on past activity has recovered and has returned to above its long-term average. The expectations on activity and demand are virtually stable. The balance on past employment has increased again but the balance on expected employment has gone down and has come back slightly below its long-term average.
Administrative and support service activities
In administrative and support service activities, the balance on past activity has improved markedly and has returned to above its long-term average. The balance on expected activity is stable and above its long-term average. The expectations on demand have slipped back but the corresponding balance remains above its long-term average. The balances on employment have decreased, albeit remaining above their long-term average, particularly in temporary work agencies.
graphiquegraph_bonus_ – Past activity in services
tableauTable_det – Detailed data
| A21 | Average* | Dec. 15 | Jan. 16 | Feb. 16 | March 16 |
|---|---|---|---|---|---|
| (H) Road transport | |||||
| Past activity | –8 | –6 | –2 | –8 | –5 |
| Expected activity | –9 | –4 | –5 | –5 | –3 |
| Expected demand | –13 | –14 | –11 | –10 | –5 |
| Past employment | –8 | –3 | –3 | –5 | –6 |
| Expected employment | –11 | –4 | –3 | –3 | –1 |
| (I) Accommodation and food service activities | |||||
| Past activity | –7 | –10 | –14 | –5 | 1 |
| Expected activity | –7 | –5 | 0 | 0 | –6 |
| Expected demand | –9 | –7 | –3 | –7 | –9 |
| Past employment | –4 | 3 | 2 | –5 | 5 |
| Expected employment | –5 | –6 | –7 | 7 | 6 |
| (J) Information and communication | |||||
| Past activity | 8 | –10 | –6 | 8 | 0 |
| Expected activity | 10 | 0 | 0 | 2 | 0 |
| Expected demand | 10 | 1 | 14 | 11 | 9 |
| Past employment | 6 | 5 | 10 | 12 | 7 |
| Expected employment | 10 | 9 | 8 | 7 | 6 |
| (L) Real estate activities | |||||
| Past activity | 7 | 5 | 8 | –4 | –14 |
| Expected activity | 7 | –1 | 1 | 3 | –2 |
| Expected demand | 1 | –5 | –5 | –1 | –8 |
| Past employment | 3 | 3 | 4 | 1 | 11 |
| Expected employment | 2 | 6 | 11 | 4 | –4 |
| (M) Professional, scientific and technical activities | |||||
| Past activity | –1 | 2 | 1 | –2 | 1 |
| Expected activity | –2 | –5 | –5 | –4 | –5 |
| Expected demand | –6 | –7 | –8 | –6 | –6 |
| Past employment | 1 | 5 | 1 | 4 | 8 |
| Expected employment | 0 | 3 | 1 | 2 | –1 |
| (N) Administrative and support service activities | |||||
| Past activity | 6 | 9 | 3 | 2 | 11 |
| Expected activity | 5 | 3 | 5 | 8 | 8 |
| Expected demand | 3 | 2 | 1 | 9 | 4 |
| Past employment | 8 | 29 | 26 | 18 | 11 |
| Expected employment | 7 | 18 | 24 | 25 | 18 |
- * Average of the balances of opinion since 1988 (2006 for road transport)
Documentation
Methodology (2016) (pdf,158 Ko)
Pour en savoir plus
Time series : Economic outlook surveys – Services
