


 18 March 2016
2016- n° 67In Q4 2015, the labour cost index - wages and salaries increased by 0.5% and the labour
cost index - total labour cost increased by 0.4% Labor cost index in industry, construction and services - 4th Quarter 2015
18 March 2016
2016- n° 67In Q4 2015, the labour cost index - wages and salaries increased by 0.5% and the labour
cost index - total labour cost increased by 0.4% Labor cost index in industry, construction and services - 4th Quarter 2015
In the fourth quarter of 2015, the labour cost index (LCI) - wages & salaries in the non-agricultural market sector accelerated quarter-on-quarter (+0.5% after +0.1% in seasonally adjusted data), and, more slightly, in year-on-year (+1.6% after +1.5% in Q3 2015). Average working hours increased slightly (+0.1% in y-o-y after being stable in Q3 2015).
- The labour cost index - wages & salaries increased by 0.5%
- Wages recovered in industry and construction
- Wages slowed down slighlty in services
- Variation confirmed for the Q3 2015 LCI – wages and salaries
- The labour cost index - total labour cost increased by 0.4%
- Slight downward revision of Q3 2015 LCI – total labour cost

Warnings:
- Since the Q1 2015 publication, upon Eurostat request, the reference year for the labour cost indices has been 2012: the average of the four 2012 quaterly indices is equal to 100.
- Since the Q2 2015 publication, the LCI – total labour cost integrate supplementary cost components calculated on the basis of the 2012 Labour cost survey (LCS). Moreover, the LCI – total labour cost now integrate the wage bill relative to the tax credit for encouraging competitiveness and employment (CICE) that firms report in the ACOSS contribution forms. The CICE is included in labour cost indices as a subsidy received by the employer. The CICE has no impact on the variation of LCI – wages & salaries.
The labour cost index - wages & salaries increased by 0.5%
In the fourth quarter of 2015, the labour cost index (LCI) - wages & salaries in the non-agricultural market sector accelerated quarter-on-quarter (+0.5% after +0.1% in seasonally adjusted data), and, more slightly, in year-on-year (+1.6% after +1.5% in Q3 2015). Average working hours increased slightly (+0.1% in y-o-y after being stable in Q3 2015).
graphiqueGraphSSangl – LCI - wages and salaries: year-on-year changes
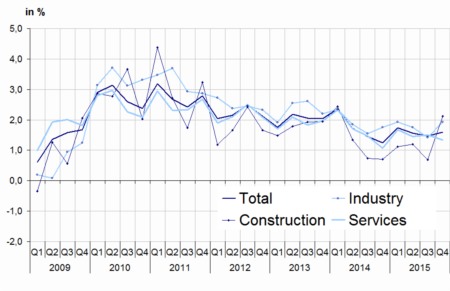
- Field: non-agricultural market sector excluding household services
- Sources: ACOSS, DARES, INSEE
Wages recovered in industry and construction
In Q4 2015, wages rebounded in industrial activities (+1.1% q-o-q after −0.2% in Q3 2015). Wages notably picked up in manufacturing (+1.2% after −0.1%). They stabilised in electricity and gas (0.0% after −1.7%). Year-on-year, wages gathered pace in industry (+1.9% after +1.4% in Q3).
In construction, wages bounced back markedly in Q4 2015 (+1.8% q-o-q after −0.3% in Q3). Year-on-year, wages accelerated sharply (+2.1% after +0.7%).
Wages slowed down slighlty in services
In services, wages slowed down slightly in Q4 (+0.1% q-o-q after +0.2% in Q3). Year-on-year, wages decelerated too (+1.3% after +1.5%).
tableautableauSSangl – LCI - wages & salaries
| Quarterly variations (%) | Annual variations (%) | |||
|---|---|---|---|---|
| Q3-15 | Q4-15 | Q3-15 | Q4-15 | |
| Industry | –0.2 | 1.1 | 1.4 | 1.9 |
| Mining and quarrying | –5.1 | 2.1 | 0.5 | 2.4 |
| Manufacturing | –0.1 | 1.2 | 1.4 | 2.0 |
| Electricity, gas, steam and air conditioning supply | –1.7 | 0.0 | 1.5 | 1.3 |
| Water supply; sewerage, waste management and remediation activities | 0.4 | 0.5 | 0.7 | 1.5 |
| Services | 0.2 | 0.1 | 1.5 | 1.3 |
| Wholesale and retail trade; repair of motor vehicles and motorcycles | 0.3 | 0.1 | 1.6 | 1.4 |
| Transportation and storage | –0.4 | 0.0 | 1.0 | 0.8 |
| Accommodation and food service activities | –0.6 | 0.1 | 1.0 | 0.6 |
| Information and communication | 0.3 | 0.0 | 2.0 | 1.6 |
| Financial and insurance activities | 1.0 | 0.3 | 1.8 | 2.2 |
| Real estate activities | 0.2 | 1.8 | 2.9 | 3.7 |
| Professional, scientific and technical activities | 0.2 | 0.3 | 1.2 | 2.0 |
| Administrative and support service activities | 0.1 | –0.5 | 1.8 | 0.8 |
| Construction | –0.3 | 1.8 | 0.7 | 2.1 |
| TOTAL | 0.1 | 0.5 | 1.5 | 1.6 |
- Field: non-agricultural market sector excluding household services
- Sources: ACOSS, DARES, INSEE
Variation confirmed for the Q3 2015 LCI – wages and salaries
The LCI - wages and salaries in the third quarter of 2015 in the non-agricultural market sector excluding household services is not revised neither quarter-on-quarter, nor year-on-year.
The labour cost index - total labour cost increased by 0.4%
In the fourth quarter of 2015, the labour cost index (LCI) - total labour cost in the non-agricultural market sector increased more than in the previous quarter (+0.4% in seasonnally adjusted data, after +0.1%).
Year-on-year, the LCI - total labour cost increased at virtually the same pace as in the previous quarter (+1.1% after +1.0%). Without the tax credit for encouraging competitiveness and jobs (CICE), the growth would have been the same.
graphiqueGraphSCangl – LCI - total labor cost: year-on-year changes
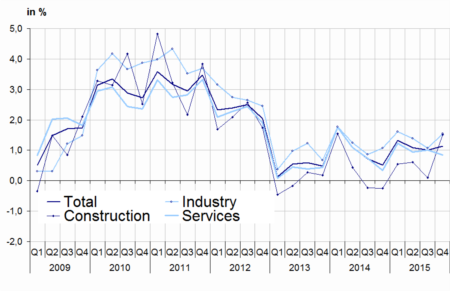
- Field: non-agricultural market sector excluding household services
- Sources: ACOSS, DARES, INSEE
Slight downward revision of Q3 2015 LCI – total labour cost
The variation of LCI – total labour cost in the non-agricultural market sector excluding household services in the third quarter of 2015 has been revised downwards by 0.1 percentage points, year-on-year as well as quarter-on-quarter.
tableautableauSCangl – LCI - total labor cost
| Quarterly variations (%) | Annual variations (%) | |||
|---|---|---|---|---|
| Q3-15 | Q4-15 | Q3-15 | Q4-15 | |
| Industry | –0.2 | 1.1 | 1.1 | 1.5 |
| Mining and quarrying | –5.2 | 2.2 | –0.3 | 1.7 |
| Manufacturing | 0.0 | 1.2 | 1.1 | 1.6 |
| Electricity, gas, steam and air conditioning supply | –1.6 | 0.0 | 1.5 | 1.2 |
| Water supply; sewerage, waste management and remediation activities | 0.4 | 0.5 | 0.1 | 0.9 |
| Services | 0.2 | 0.1 | 1.0 | 0.9 |
| Wholesale and retail trade; repair of motor vehicles and motorcycles | 0.4 | 0.1 | 1.1 | 0.8 |
| Transportation and storage | –0.4 | 0.0 | 0.3 | 0.1 |
| Accommodation and food service activities | –0.7 | 0.2 | –0.1 | –0.3 |
| Information and communication | 0.3 | 0.0 | 1.9 | 1.5 |
| Financial and insurance activities | 1.1 | 0.3 | 1.8 | 2.1 |
| Real estate activities | 0.3 | 1.9 | 2.6 | 3.5 |
| Professional, scientific and technical activities | 0.2 | 0.3 | 1.1 | 1.8 |
| Administrative and support service activities | 0.1 | –0.6 | 0.7 | –0.3 |
| Construction | –0.2 | 1.9 | 0.1 | 1.5 |
| TOTAL | 0.1 | 0.4 | 1.0 | 1.1 |
- Field: non-agricultural market sector excluding household services
- Sources: ACOSS, DARES, INSEE
tableautableauhCICEangl – LCI - total labor cost (without CICE)
| Quarterly variations (%) | Annual variations (%) | |||
|---|---|---|---|---|
| Q3-15 | Q4-15 | Q3-15 | Q4-15 | |
| Industry | –0.2 | 1.1 | 1.1 | 1.6 |
| Mining and quarrying | –5.2 | 2.2 | 0.1 | 2.1 |
| Manufacturing | 0.0 | 1.2 | 1.1 | 1.6 |
| Electricity, gas, steam and air conditioning supply | –1.6 | 0.0 | 1.5 | 1.2 |
| Water supply; sewerage, waste management and remediation activities | 0.4 | 0.5 | 0.1 | 1.0 |
| Services | 0.2 | 0.1 | 1.0 | 0.9 |
| Wholesale and retail trade; repair of motor vehicles and motorcycles | 0.4 | 0.1 | 1.2 | 0.9 |
| Transportation and storage | –0.4 | 0.0 | 0.3 | 0.1 |
| Accommodation and food service activities | –0.7 | 0.2 | –0.1 | –0.3 |
| Information and communication | 0.3 | 0.0 | 1.9 | 1.5 |
| Financial and insurance activities | 1.1 | 0.3 | 1.8 | 2.1 |
| Real estate activities | 0.3 | 1.9 | 2.6 | 3.5 |
| Professional, scientific and technical activities | 0.2 | 0.3 | 1.1 | 1.8 |
| Administrative and support service activities | 0.1 | –0.6 | 0.7 | –0.3 |
| Construction | –0.2 | 1.9 | 0.1 | 1.5 |
| TOTAL | 0.1 | 0.4 | 1.0 | 1.1 |
- Field: non-agricultural market sector excluding household services
- Sources: ACOSS, DARES, INSEE
Documentation
Methodological Note (pdf,132 Ko)
Supplementary Methodological Note SA-WDA (pdf,257 Ko)
Pour en savoir plus
