


 28 April 2016
2016- n° 111Overall producer prices of agricultural products increased by 1.5 % in March 2016 Indices of agricultural prices - March 2016
28 April 2016
2016- n° 111Overall producer prices of agricultural products increased by 1.5 % in March 2016 Indices of agricultural prices - March 2016
In March 2016, overall agricultural producer prices picked up (+1.5% after −0.9% in February). Over one year, they decreased by 1.4%.
In March 2016, overall agricultural producer prices picked up (+1.5% after −0.9% in February). Over one year, they decreased by 1.4%.
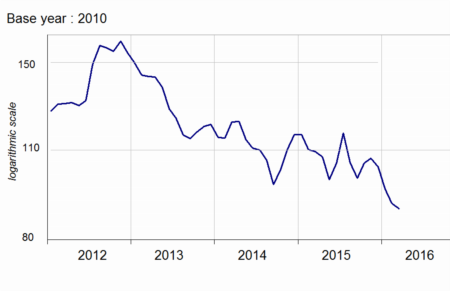
Further declines in cereal and oleaginous prices
Cereal prices kept on decreasing in March (−2.0% over the month and −16.4% since November 2015) reflecting the abundant global supply and anticipations of significant crops to be harvested in the Northern hemisphere.
graphiquecereal – Producer prices of cereals
- Source: INSEE
Oleaginous prices continued to fall too (−1.2% over the month and −10.2% since November 2015). Less expensive oil reduced the interest of hydrocarbon substitution by oleaginous. Moreover the drop in Chinese importations weighed on prices.
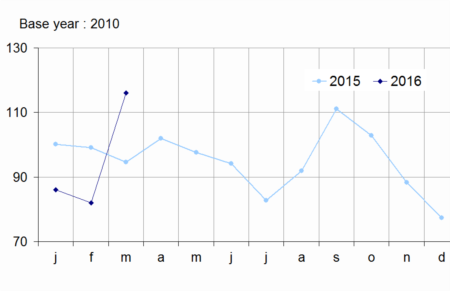
Surge in potatoe and vegetables prices, near stability in fruit prices.
Potatoe prices doubled in February over one year. The 2015 crop reached its long-term average whereas the previous one was exceptional.
Fresh fruits prices slightly increased in March (+0.8%). The strawberry demand was weak in the beginning of the season, weighing on price. On the other hand pears ans apple sold more easily. Vegetable prices jumped compared to last year (+22.7%), noticeably driven by cauliflower whose price has tripled. The mild temperatures in the end of 2015 had hastened the production of this vegetable, whose volume harvested in March fell.
graphiquevegetable – Producer prices of fresh vegetables
- Source: SSP (ministry in charge of agriculture)
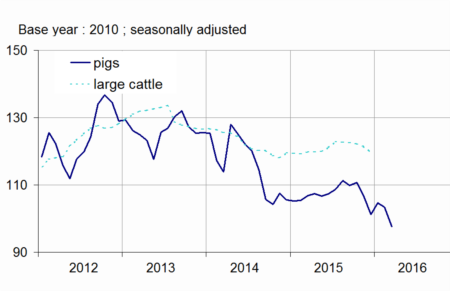
On a seasonaly adjusted basis animal prices declined over one month (−1.2%). Big cattle prices were almost stable this month (−0.1% ) and lessened over one year (−1.6%), reflecting a sluggish demand. Pig prices dropped (−5.5% over the month) due to, on the supply side, Spanish competition, and, on the demand side, to a slight switch in consumption toward lamb upon Easter. For this reason sheep prices rallied by 2.3% in March.
graphiquepig – Producer prices of pigs and large cattle
- Source: INSEE
Cow milk price sank by 9.0% over one year, as the supply saturated the demand. Since the end of the quotas, the Northern European countries indeed increased their productions, whereas the Russian embargo and the downturn in Chinese importations limited the demand.
tableauTab1 – Indices of producer prices of agricultural products (IPPAP)
| Variation as % over | |||||
|---|---|---|---|---|---|
| Weights | March 2016 | a month | 3 month | a year | |
| raw | Seasonnaly adjusted | raw | |||
| Agricultural goods output | 1,000 | 109.6 | +1.5 | –1.5 | –1.4 |
| excluding fruits and vegetables | 900 | 109.1 | –0.5 | –3.9 | –2.7 |
| Crop output (excluding fruits and vegetables) | 505 | 112.4 | –0.5 | –3.9 | –1.7 |
| Cereals | 188 | 89.3 | –2.0 | –13.7 | –18.3 |
| of which soft wheat | 112 | 84.4 | –2.5 | –15.8 | –22.3 |
| grain maize | 41 | 87.9 | +0.3 | –9.1 | –5.8 |
| Potatoes | 26 | 183.6 | /// | /// | +99.6 |
| Wines | 177 | 133.5 | –0.2 | +2.4 | +2.9 |
| Protected designation of origin | 84 | 142.9 | +0.1 | +4.5 | +6.6 |
| other wines | 23 | 145.0 | –1.6 | 0.0 | –3.8 |
| Oleaginous | 49 | 94.0 | –1.2 | –8.9 | –6.5 |
| Horticultural products | 30 | 108.0 | +3.2 | 0.0 | +2.2 |
| Other crop products | 36 | 107.6 | –0.6 | –0.1 | 0.0 |
| Fruits and vegetables (1) | 100 | 114.5 | /// | /// | +11.5 |
| Fresh vegetables | 53 | 116.1 | /// | /// | +2.,7 |
| Fresh fruits | 35 | 110.8 | /// | /// | +0.8 |
| Animal output | 395 | 104.8 | –0.4 | –3.7 | –4.0 |
| Animals | 234 | 111.0 | –1.2 | –1.3 | –2.4 |
| of which large cattle | 96 | 117.7 | –0.1 | –1.8 | –1.6 |
| calves | 26 | 113.9 | –0.2 | +2.7 | +2.6 |
| pigs | 54 | 97.1 | –5.5 | –3.6 | –8.9 |
| sheep | 10 | 116.9 | +2.3 | +0.8 | –3.4 |
| poultry | 46 | 110.6 | –0.4 | –0.5 | +0.9 |
| of which chicken | 28 | 110.1 | –0.2 | –1.0 | +0.1 |
| Milk | 147 | 92.8 | /// | –8.3 | –8.2 |
| of which cow milk (2) | 137 | 91.7 | /// | –9.0 | –9.0 |
| Eggs | 15 | 125.3 | +9.6 | –0.5 | +5.4 |
- (1) Including vegetables for industry.
- (2)The February value of cow milk price indice is carried forward in March
- Sources: INSEE, SSP (ministry in charge of agriculture)
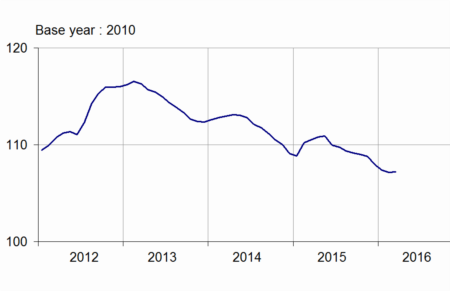
Purchase prices of means of production were stable in March
In March, intermediate consumption prices stopped declining due noticeably to picking up energy prices (+4.5%). Over one year, it dwindled by 4.1% due to energy (−16.0%), fertilisers (−7.8%) and feed (−5.1%). Capital goods prices increased by 0.2% over one month and by 0.9% over one year.
graphiquemeans – Purchase prices of the means of agricultural production
- Sources: INSEE, SSP (ministry in charge of agriculture)
tableauTab2 – Indices of purchase prices of the means of agricultural production (IPAMPA)
| Weights | March 2016 | variation as % over | |||
|---|---|---|---|---|---|
| a month | 3 months | a year | |||
| Total input | 1,000 | 106.8 | –0.0 | –0.6 | –3.0 |
| Intermediate consumptions | 764 | 106.7 | –0.0 | –1.0 | –4.1 |
| Energy | 100 | 83.0 | +4.5 | +0.6 | –16.0 |
| Seeds | 57 | 109.0 | +0.4 | –0.1 | +0.3 |
| Fertilisers and soil improvers | 92 | 112.8 | –1.1 | –2.3 | –7.8 |
| Plant protection products | 78 | 100.1 | +0.4 | –0.4 | –0.3 |
| Animal feed | 205 | 112.6 | –1.2 | –2.8 | –5.1 |
| Veterinary expenses | 43 | 116.3 | +0.1 | +1.1 | +2.6 |
| Small equipment and tools | 17 | 108.1 | –1.0 | –1.6 | +0.4 |
| Maintenance of materials | 67 | 113.3 | –0.2 | –0.3 | +0.4 |
| Maintenance of buildings | 9 | 106.5 | 0.0 | –0.1 | –0.2 |
| Other goods and services | 97 | 101.8 | 0.0 | 0.0 | +0.5 |
| Goods and services contributing to investment | 236 | 107.3 | +0.2 | +0.6 | +0.9 |
| Material | 186 | 108.7 | +0.2 | +0.8 | +1.9 |
| Tractors | 79 | 109.1 | +0.2 | +1.4 | +3.1 |
| Machinery and plant for cultivation | 36 | 110.9 | +0.3 | +1.0 | +1.8 |
| Machinery and plant for harvesting | 42 | 108.4 | +0.2 | –0.2 | +1.2 |
| Utility vehicles | 18 | 104.7 | +0.1 | +0.2 | –0.2 |
| Buildings | 50 | 102.1 | 0.0 | –0.3 | –2.6 |
- (1) The repayment of the domestic tax on energy products (TICPE) benefiting farmers has been applied in advance for the year 2016
- Sources: INSEE, SSP (ministry in charge of agriculture)
Documentation
Methodology (pdf,122 Ko)
Pour en savoir plus
Time series : Indices of agricultural prices
