


 10 May 2016
2016- n° 120In the manufacturing industry, business managers forecast a significant increase in
their investment in 2016 Industrial investment survey - April 2016
10 May 2016
2016- n° 120In the manufacturing industry, business managers forecast a significant increase in
their investment in 2016 Industrial investment survey - April 2016
Surveyed in April 2016, business managers stated that investment in manufacturing industry increased by 1% in nominal value in 2015, revising by 3 points upwards their previous expectations given in last January.
- For 2016, business managers have confirmed their investment forecast of an increase of 7%
- Business leaders are more numerous to anticipate an increase than a decrease in their investment in H2 2016
- In April, the investment revision indicator remains positive
- Investment mainly supports the replacement and modernization of equipment
Surveyed in April 2016, business managers stated that investment in manufacturing industry increased by 1% in nominal value in 2015, revising by 3 points upwards their previous expectations given in last January.
graphiqueGraph1_ang – Annual nominal change in investment in the manufacturing industry
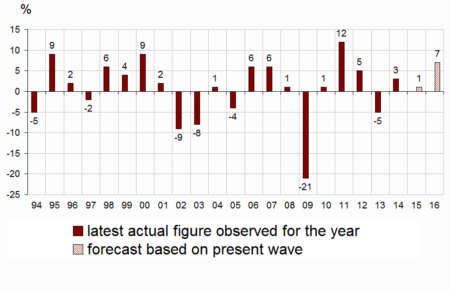
- Source: Industrial investment survey - INSEE
For 2016, business managers have confirmed their investment forecast of an increase of 7%
For 2016, business managers in the manufacturing industry forecast that their investment will increase by 7%, confirming their previous expectations given in last January. Investment should increase in all main sectors. Business managers revised theirs expectations downwards in the industry of machine and equipment (−5 points at +13%). On the contrary, they revised their expectations upwards in the manufacture of food products and beverages (+2 points at +13%).
tableauTab1_ang – Real annual investment growth
| NA* : (A17) et [A38] | In 2015 | In 2016 | ||
|---|---|---|---|---|
| estimate Jan.16 | observed Apr.16 | estimate Jan.16 | estimate Apr.16 | |
| C : MANUFACTURING INDUSTRY | –2 | 1 | 7 | 7 |
| (C1): Manufacture of food products and beverages | –7 | –1 | 11 | 13 |
| (C3): Electrical and electronic equipment; machine equipment | –3 | –1 | 18 | 13 |
| (C4): Manufacture of transport equipment | 2 | 3 | 3 | 3 |
| [CL1]: Motor vehicles | 0 | –1 | 3 | 1 |
| (C5): Other manufacturing | –1 | 1 | 4 | 4 |
| Total sectors (C3-C4-C5) | 0 | 1 | 6 | 5 |
- How to read this table: in manufacturing industry, business managers surveyed in April 2016 have announced a nominal investment increase of 1% in 2015 compared to 2014 and forecast a nominal investment increase of 7% in 2016 compared to 2015.
- * The codes correspond to the level of aggregation (A17) and [A38] of the "NA" aggregated classification based on NAF rev.2
- Source: Industrial investment survey - INSEE
Business leaders are more numerous to anticipate an increase than a decrease in their investment in H2 2016
Surveyed in April 2016, business managers are slightly more numerous to anticipate an increase rather than a decrease in their investment between H2 2015 and H1 2016. For H2 2016, this trend is gathering pace and clearly more business leaders anticipate an increase than a decrease of their investment. The corresponding balance of opinion (+15) has reached its highest level since 2011.
graphiqueGraph2_ang – Six-month change in investment (first estimation)
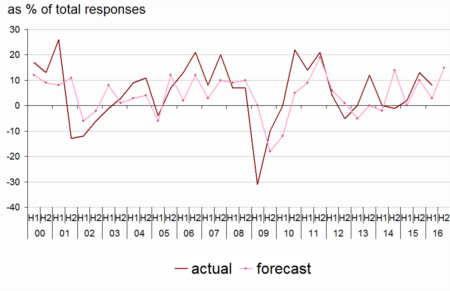
- Source: Industrial investment survey - INSEE
In April, the investment revision indicator remains positive
The investment revision indicator remains positive in April because business managers are slightly more numerous to revise their investment forecast upwards rather than downwards. This indicator is based on investment amounts reported in at each survey by business leaders of the manufacturing industry except those of manufacture of food products and beverages and of coke and refined petroleum products.
graphiqueGraphIR_ang – Investment revision indicator
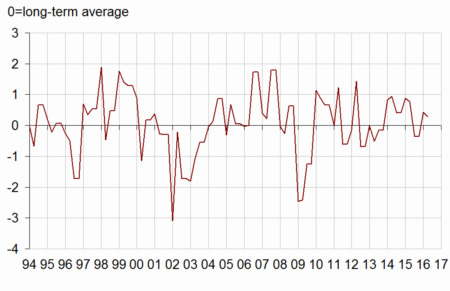
- Source: Industrial investment survey - INSEE
Investment mainly supports the replacement and modernization of equipment
In 2016, the purposes of investment should be quite similar to those of 2015. The current distribution is close to the average distribution observed since 1991. The share of investment devoted to replacement stays the most important, slightly above its long-term average. A quarter of investment would be used for the modernization of equipment, the share for energy savings remains slightly above its long-term average. On the contrary, the share of investment aimed to increase productive capacity or introduce to introduction of new products is likely to remain a little below its long-term average.
tableauTab2_ang – Share of purposes of investment
| Average | 2015 | 2016 | |
|---|---|---|---|
| 1991-2015 | actual | forecast | |
| Replacement | 27 | 28 | 28 |
| Modernization, streamlining | 24 | 23 | 24 |
| of which : automation | 11 | 8 | 8 |
| of which : new production methods | 7 | 7 | 8 |
| of which : energy savings | 6 | 8 | 8 |
| Increase in productive capacity | 16 | 15 | 14 |
| Introduction of new products | 14 | 14 | 13 |
| Other purposes (safety, environment, working conditions…) | 20 | 20 | 21 |
- Source: Industrial investment survey - INSEE
The balance of opinion about the change in productive capacity observed in 2015 (+23) confirms the forecast estimated last year (+21). For 2016, business leaders are more numerous than in 2015 to anticipate an increase of the productive capacity: the balance of opinion has grown to +28 but it remains above its long-term average (+31).
tableauTab3a_ang – Productive capacity and equipment scrapping
| Observed | Forecast | ||||
|---|---|---|---|---|---|
| aver. | in 2015 | aver. | for 2015 | for 2016 | |
| Change in productive capacity* | 29 | 22 | 31 | 21 | 28 |
| Change in equipment scrapping* | 18 | 15 | –2 | 16 | –7 |
| Share of enterprises reporting equipment scrapping** | 76 | 71 | 75 | 66 | 67 |
| Breakdown of enterprises reporting equipment scrapping** | |||||
| Wear and tear, obsolescence | 52 | 53 | 49 | 56 | 49 |
| Installation of more efficient equipment | 31 | 29 | 33 | 32 | 29 |
| Shut-down of capacity for old products | 12 | 10 | 12 | 9 | 13 |
| Other scrapping | 5 | 8 | 6 | 3 | 9 |
| Total | 100 | 100 | 100 | 100 | 100 |
- Source: INSEE - Industrial investment survey
Documentation
Methodology (pdf,34 Ko)
Pour en savoir plus
Time series : Industry – Investment
