


 21 April 2016
2016- n° 106In the first quarter 2016, production capacity are more used in the manufacturing
industry Quarterly business survey (goods-producing industries) - April 2016
21 April 2016
2016- n° 106In the first quarter 2016, production capacity are more used in the manufacturing
industry Quarterly business survey (goods-producing industries) - April 2016
In April 2016, the industrialists have reported that they used more their machinery and equipment. The production capacity utilisation rate has increased compared to the previous quarter (+1.2 point). Since the third quarter of 2008, production capacity has been less used in the manufacturing industry than it was on average between 1994 and 2007.

Warning: in the publication of April 2016, weights used to aggregate business managers' answers to the questions related to exports have been updated in order to be consistent with those used for other variables. As a result, the value of all the balances of opinion related to exports published in this survey have been negligibly modified at the most aggregated level but more significantly in a sector-based approach.
Increased use of the production capacity
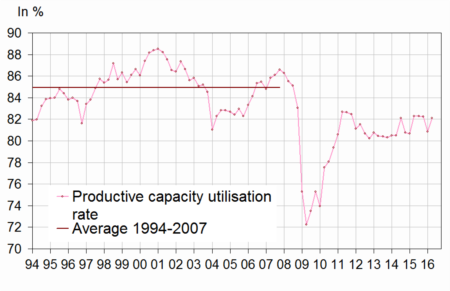
In April 2016, the industrialists have reported that they used more their machinery and equipment. The production capacity utilisation rate has increased compared to the previous quarter (+1.2 point). Since the third quarter of 2008, production capacity has been less used in the manufacturing industry than it was on average between 1994 and 2007.
As many industrialists as in the previous quarter consider that they could produce more if they received more orders: the balance on production bottlenecks is stable and close to normal. The proportion of industrialists indicating difficulties of supply only is stable and significantly below normal. Besides, a few less industrialists have reported difficulties of demand only.
graphiqueGraphang2 – Productive capacity utilisation rate
Improvement in demand during the past months
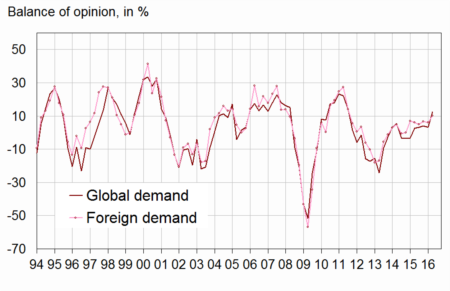
In April 2016, more industrialists than in January judge that global and export demand increased in the past months; the corresponding balances are well above their mean level. Over the next three months, industrialists are slightly less optimistic on future demand, especially from abroad; however, the corresponding balances of opinion are still above average.
graphiqueGraphang1_bis – Balance of opinion of past change in demand
tableautableau1 – Industrialists' opinion: demand and production factors
| Manufacturing industry | Mean | July 15 | Oct. 15 | Jan. 16 | April 16 |
|---|---|---|---|---|---|
| Global demand | |||||
| Past change | 0 | 3 | 4 | 3 | 12 |
| Future change | 1 | 5 | 7 | 6 | 4 |
| Foreign demand | |||||
| Past change | 2 | 5 | 7 | 6 | 10 |
| Future change | 4 | 8 | 13 | 12 | 6 |
| Production factors | |||||
| Production bottlenecks (in %) | 22 | 25 | 29 | 24 | 24 |
| Assessment of productive capacity | 14 | 20 | 16 | 11 | 8 |
| Production capacity utilisation rate (in %) | 84.5 | 82.3 | 82.2 | 80.9 | 82.1 |
| Difficulties of supply and demand (in %) | |||||
| Difficulties of supply and demand | 8 | 11 | 10 | 10 | 10 |
| Difficulties of supply | 20 | 21 | 15 | 14 | 14 |
| Difficulties of demand | 44 | 37 | 43 | 42 | 40 |
- * : Long-term average since 1976.
- The results of the last survey are preliminary.
- Source: INSEE - Quarterly business survey
Less recent staff cuts reported
In April 2016, slightly less industrialists than in January have reported that they reduced workforce in the past three months. Over the next few months, almost as many industrialists as in the previous quarter forecast job losses. Both balances have however been above their long-term average since October 2013.
Three out of ten industrialists have experienced hiring difficulties; this part has been virtually stable since April 2013 and close to its long-term average.
graphiqueGraphang3 – Workforce size in the manufacturing industry
Slight increase in wages
According to the business managers in the manufacturing industry, wages increased again in the past three months (+0.2% after +0.3%).
Since April 2015, the balance of opinion on past change in working time has been virtually stable above its long-term average. Over the next months, their opinion is unchanged, with a corresponding balance above normal.
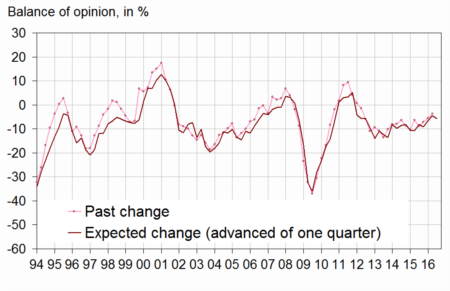
Further decline in selling prices
According to industrialists, selling prices in the manufacturing industry dropped again in the first quarter (−0.5% after −0.6%). Business managers forecast stabilization for the next quarter.
As many industrialists as in the previous quarter have experienced cash-flow problems (11%). This proportion stands below its mean level (15%).
Improvement in the opinion on competitive position outside European Union
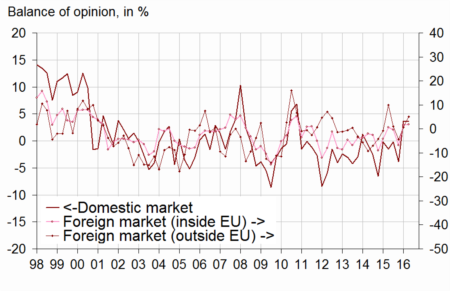
In April 2016, the balance of opinion on competitive position outside European Union has increased again, while those on competitive position on domestic market and on foreign market inside European Union are stable. These three balances are above their long-term average. However, industrialists are less optimistic than in January on general exportation prospects: the corresponding balance has lost 8 points but remains above its long period average.
graphiqueGraphang4 – Competitive position
tableautableau2 – Industrialists' opinion: employment, competitive position, cash-flow, wages and selling prices
| Manufacturing industry | Mean | July 15 | Oct. 15 | Jan. 16 | April 16 |
|---|---|---|---|---|---|
| Workforce size | |||||
| Past change | −11 | −9 | −7 | −6 | −4 |
| Expected change | −13 | −9 | −6 | −5 | −6 |
| Difficulties hiring (in %) | 28 | 29 | 29 | 30 | 31 |
| Working time | |||||
| Past change | −3 | 1 | 2 | 2 | 3 |
| Expected change | −5 | −1 | 2 | −1 | −1 |
| Cash-flow and wages | |||||
| Cash-flow problems (in %) | 15 | 13 | 13 | 11 | 11 |
| Past wages | 0,5 | 0,3 | 0,3 | 0,3 | 0,2 |
| Selling prices | |||||
| Past change | 0.1 | 0.1 | −1.4 | −0.6 | −0.5 |
| Expected change | 0.2 | −0.2 | −1.4 | −0.5 | 0.0 |
| Competitive position | |||||
| On domestic market | 1 | 0 | −4 | 4 | 4 |
| On foreign markets inside EU | −2 | 0 | −7 | 2 | 2 |
| On foreign markets outside EU | −2 | 1 | −4 | 1 | 5 |
| General exportation expectations | −10 | 5 | 4 | 2 | −6 |
- * : Long-term average since 1976.
- The results of the last survey are preliminary.
- A quantitative question is asked about selling prices and past wage.
- Source: INSEE - Quarterly business survey
Documentation
Methodology (pdf,48 Ko)
Pour en savoir plus
Time series : Industry
