


 21 January 2016
2016- n° 18In January 2016, the business climate in services has returned to its long-term average Monthly survey of services - January 2016
21 January 2016
2016- n° 18In January 2016, the business climate in services has returned to its long-term average Monthly survey of services - January 2016
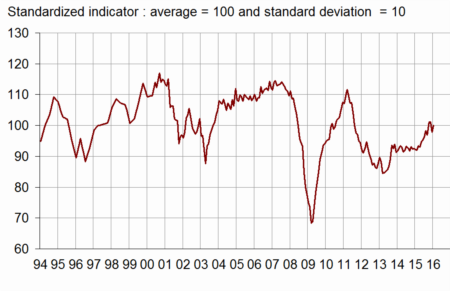
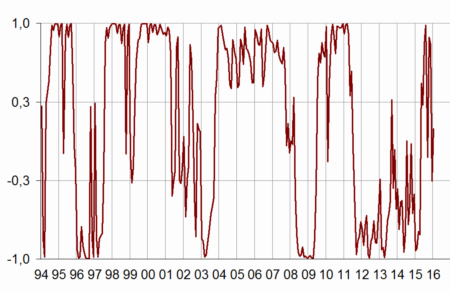
According to business managers, the business climate in services has improved in January 2016. The composite indicator which measures it has increased by two points and has returned to its long-term average (100) after a decline in December 2015. The turning point indicator remains in the uncertainty area.
All services
According to business managers, the business climate in services has improved in January 2016. The composite indicator which measures it has increased by two points and has returned to its long-term average (100) after a decline in December 2015. The turning point indicator remains in the uncertainty area.
graphiqueGraph1 – Business climate composite indicator
graphiquegraph_retourn – Turning point indicator
Revisions
The business climate in services in December 2015 has been revised downward by one point since its first estimate, because of late businesses' answers which have been taken into account.
The balance of opinion on the general outlook, which relates the assessment of business leaders over their whole sector, has improved markedly and has returned above its long-term average.
The balance on past activity is virtually stable. However, more business leaders than in last month expect an increase in activity and demand in the incoming months.
The balance of opinion on the past operating balance is virtually stable, above its long-term mean. The balance on expected operating balance has dropped back below its long-term average.
The balances on past and expected employment have gone up anew and have stood above their long-term average since July 2015.
tableauTable_quarter – Economic outlook in the services sector
| Average* | Oct. 15 | Nov. 15 | Dec. 15 | Jan. 16 | |
|---|---|---|---|---|---|
| Composite indicator | 100 | 101 | 101 | 98 | 100 |
| General outlook | –8 | –7 | –7 | –9 | –5 |
| Past activity | 2 | 4 | 4 | –1 | –2 |
| Expected activity | 2 | 1 | 1 | –2 | 0 |
| Expected demand | –1 | –2 | 1 | –4 | –1 |
| Past selling prices | –4 | –7 | –5 | –7 | –7 |
| Expected selling prices | –3 | –6 | –6 | –10 | –12 |
| Past employment | 3 | 10 | 14 | 11 | 14 |
| except temporary work agencies | 1 | 3 | 7 | 2 | 6 |
| Expected employment | 2 | 8 | 8 | 7 | 10 |
| except temporary work agencies | –1 | –1 | 3 | 2 | 1 |
| Investments | |||||
| Past investments | 1 | 8 | 7 | 7 | 5 |
| Expected investments | 1 | 2 | 4 | 7 | 6 |
| Operating balance result | |||||
| Past result | –2 | 2 | 1 | ||
| Expected result | –2 | 2 | –4 | ||
| Cash position | –11 | –11 | –9 | ||
| Difficulties of supply and demand | |||||
| difficulties of supply and demand | 10 | 11 | 14 | ||
| difficulties of supply only | 22 | 21 | 19 | ||
| difficulties of demand only | 32 | 37 | 36 | ||
| Difficulties in recruitment | 28 | 21 | 22 |
- * Average of the balances of opinion since 1988
- Source: Insee
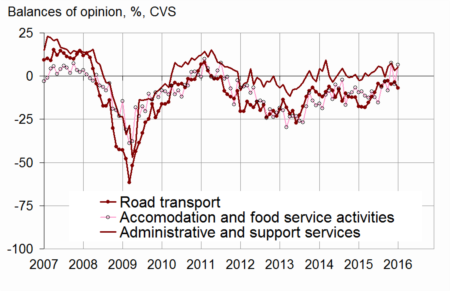
Road transport
In road freight, the balance on past activity has increased again. The business prospects have dipped slightly but the corresponding balance remains above its long-term average. The balances on employment are almost unchanged, above their long-term average.
Accommodation and food service activities
In accommodation and food service activities, the balance on past activity has decreased slightly and stands below its long-term average. After a sharp decline in December 2015, the balances on expected activity and demand have recovered. The balances on past and expected employment have increased and stand well above their long-term average.
Information and communication
In information and communication, the balance on past activity has gone up but remains far below its long-term average. However, the expectations on demand have rebounded and the corresponding balance have returned above its long-term average.
Real estate
In real estate, the balances of opinion on past and expected activity have increased slightly. The expectations on demand are virtually stable, below their long-term average. The balances on employment have improved and stand above their long-term average.
Professional, scientific and technical activities
In professional, scientific and technical activities, the balances on activity and demand are almost unchanged. The expectations on activity and demand remain below their long-term average. The balances on employment have decreased slightly and stand close to their long-term average.
Administrative and support service activities
In administrative and support service activities, the balance on past activity has fallen back below its long-term average. Nevertheless, the balance on expected activity has increased and has returned to its long-term average. The balances on employment have improved again and have been far above their long-term average since the summer 2015, particularly in temporary work agencies.
graphiquegraph_bonus_ – Expected activity in services
tableauTable_det – Detailed data
| A21 | Average* | Oct. 15 | Nov. 15 | Dec. 15 | Jan. 16 |
|---|---|---|---|---|---|
| (H) Road transport | |||||
| Past activity | –8 | –8 | –9 | –6 | 0 |
| Expected activity | –10 | –3 | –5 | –4 | –7 |
| Expected demand | –13 | –6 | –6 | –14 | –13 |
| Past employment | –8 | –4 | 3 | –3 | –2 |
| Expected employment | –11 | –4 | –2 | –4 | –4 |
| (I) Accommodation and food service activities | |||||
| Past activity | –7 | –3 | 3 | –10 | –12 |
| Expected activity | –7 | –8 | 8 | –5 | 7 |
| Expected demand | –9 | –9 | 7 | –7 | 2 |
| Past employment | –4 | 2 | 11 | 3 | 8 |
| Expected employment | –5 | –2 | –5 | –6 | 0 |
| (J) Information and communication | |||||
| Past activity | 8 | 3 | –2 | –10 | –7 |
| Expected activity | 10 | 3 | –5 | 0 | –1 |
| Expected demand | 10 | 3 | 3 | 1 | 14 |
| Past employment | 6 | 1 | 4 | 5 | 9 |
| Expected employment | 10 | 8 | 9 | 9 | 6 |
| (L) Real estate activities | |||||
| Past activity | 7 | 16 | 15 | 5 | 7 |
| Expected activity | 7 | 7 | 3 | –1 | 2 |
| Expected demand | 1 | –5 | 2 | –5 | –6 |
| Past employment | 3 | 7 | 6 | 3 | 4 |
| Expected employment | 2 | 10 | 10 | 6 | 12 |
| (M) Professional, scientific and technical activities | |||||
| Past activity | –1 | 4 | 3 | 2 | 1 |
| Expected activity | –2 | 0 | –1 | –5 | –4 |
| Expected demand | –6 | –4 | –4 | –7 | –9 |
| Past employment | 1 | 2 | 5 | 5 | 3 |
| Expected employment | 0 | –1 | 4 | 3 | 1 |
| (N) Administrative and support service activities | |||||
| Past activity | 5 | 10 | 8 | 9 | 2 |
| Expected activity | 5 | 5 | 7 | 3 | 5 |
| Expected demand | 2 | 5 | 3 | 2 | 0 |
| Past employment | 8 | 25 | 27 | 29 | 30 |
| Expected employment | 7 | 20 | 16 | 18 | 27 |
- * Average of the balances of opinion since 1988 (2006 for road transport)
Documentation
Methodology (2016) (pdf,158 Ko)
Pour en savoir plus
Time series : Economic outlook surveys – Services
