


 31 March 2016
2016- n° 84In March 2016, consumer prices decreased by 0.2% year-on-year Consumer price index - provisional results - March 2016
31 March 2016
2016- n° 84In March 2016, consumer prices decreased by 0.2% year-on-year Consumer price index - provisional results - March 2016
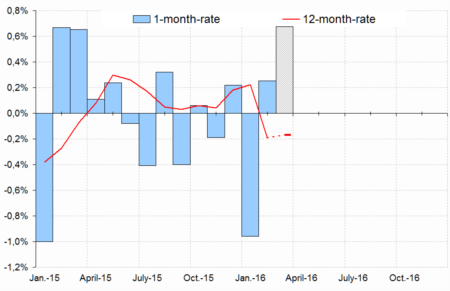
In March 2016, according to the provisional estimate made at the end of the month, the Consumer Price Index (CPI) is set to rise by 0.7% month-on-month, as in March 2015. This increase should result primarily from a seasonal price upturn in manufactured product after the end of winter sales. Furthermore, food prices, particularly for fresh foodstuffs, should accelerate. Energy prices are likely to increase after nine consecutive months of decline.
In March 2016, according to the provisional estimate made at the end of the month, the Consumer Price Index (CPI) is set to rise by 0.7% month-on-month, as in March 2015. This increase should result primarily from a seasonal price upturn in manufactured product after the end of winter sales. Furthermore, food prices, particularly for fresh foodstuffs, should accelerate. Energy prices are likely to increase after nine consecutive months of decline.
Year-on-year, consumer prices should edge down in March 2016 as in the previous month (−0.2%) due to the pronounced drop in energy prices during the last months and also, sharp to a lesser extent, to the decrease in prices of manufactured products. The rise in service prices is likely to remain moderate.
In March 2016, the Harmonised Index of Consumer Prices is set to grow by 0.8% compared with the previous month, owing to same trends as for the CPI. Year-on-year, it should decrease by 0.1%, as in the previous month.

Warning: these provisional results are only preliminary data. Accordingly, they should not be used for contractual revaluations. The indices published here are based on a limited set of price observations and from estimates of some rates of change for fares which are not yet available. The complete results will be published on 13 April 2016.
tableautableauFE_English – Consumer price index
| Weight 2016 | March 2015 | Feb. 2016 | March 2016 (p) | |
|---|---|---|---|---|
| CPI - All items* | 10000 | −0.1 | −0.2 | −0.2 |
| Food | 1615 | 0.1 | 0.2 | 0.4 |
| - Fresh food | 217 | 5.1 | 0.4 | 1.2 |
| - Other food products | 1398 | −0.6 | 0.2 | 0.3 |
| Tobacco | 195 | 0.3 | 0.3 | 0.0 |
| Energy | 773 | −3.7 | −6.8 | −7.0 |
| Manufactured products | 2651 | −1.0 | −0.1 | −0.2 |
| Services | 4766 | 1.1 | 0.8 | 0.8 |
| HICP** - All items | 10000 | 0.0 | −0.1 | −0.1 |
graphiqueGraphiqueFE_English – Variations of the consumer price index*
Pour en savoir plus
