


Quarterly national accounts in Q4 2015 National accounts in base 2010 - Detailed figures
In Q4 2015, households’ purchasing power and non-financial corporations’ profit ratio kept on increasing Quarterly national accounts - detailed figures - 4th quarter 2015
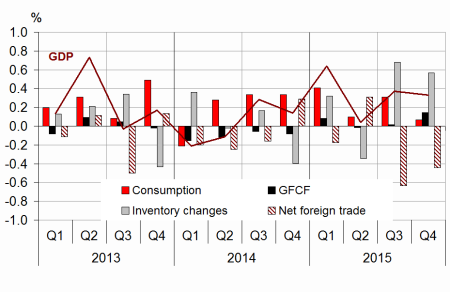
In Q4 2015, GDP in volume terms* increased by 0.3%. On average over the year, growth accelerated: +1.2% in 2015 after +0.2% in 2014.
In Q4 2015, GDP in volume terms* increased by 0.3%. On average over the year, growth accelerated: +1.2% in 2015 after +0.2% in 2014.
Total gross fixed capital formation (GFCF) accelerated in Q4 (+0.7% after +0.1%) mostly driven up by non-financial corporations and general government. Household final consumption expenditure fell back (−0.1% after +0.4% in Q3 2015). All in all, final domestic demand excluding inventory changes decelerated slightly and contributed +0.2 points to GDP growth (after +0.3 points in previous quarter).
Exports rebounded (+1.1% after −0.2%) and imports accelerated (+2.4% after +1.8%). In fine, the foreign trade balance contributed negatively to activity (−0.4 points after −0.6 points in Q3). On the contrary, changes in inventories contributed positively to GDP growth (+0.6 points, after +0.7 points).

* This growth rate is seasonally and working-day adjusted; volumes are chain-linked previous-year-prices volumes.
graphiqueGraph1 – GDP and its main components
- Source: INSEE
tableauTab1 – Goods and services:supply and uses chain-linked volumes
| 2015 Q1 | 2015 Q2 | 2015 Q3 | 2015 Q4 | 2014 | 2015 | |
|---|---|---|---|---|---|---|
| GDP | 0.6 | 0.0 | 0.4 | 0.3 | 0.2 | 1.2 |
| Imports | 2.2 | 1.0 | 1.8 | 2.4 | 3.9 | 6.7 |
| Household consumption *expenditure | 0.6 | 0.0 | 0.4 | -0.1 | 0.6 | 1.4 |
| General government's *consumption expenditure | 0.2 | 0.3 | 0.4 | 0.5 | 1.5 | 1.5 |
| GFCF | 0.4 | -0.1 | 0.1 | 0.7 | -1.2 | 0.0 |
| *of which Non-financial corporated and unincorporated enterprises | 0.9 | 0.5 | 0.5 | 1.2 | 2.0 | 2.0 |
| Households | -0.5 | -1.0 | -0.5 | -1.0 | -5.3 | -2.8 |
| General government | 0.0 | -0.5 | -0.4 | 1.1 | -6.9 | -3.0 |
| Exports | 1.7 | 2.0 | -0.2 | 1.1 | 2.4 | 6.1 |
| Contributions : | ||||||
| Internal demand excluding inventory changes | 0.5 | 0.1 | 0.3 | 0.2 | 0.5 | 1.1 |
| Inventory changes | 0.3 | -0.3 | 0.7 | 0.6 | 0.2 | 0.4 |
| Net foreign trade | -0.2 | 0.3 | -0.6 | -0.4 | -0.5 | -0.3 |
- Source: INSEE
Households’ purchasing power slowed in Q4 2015 (+0.4% after +0.9%) yet accelerated over the year (+1.8% after +1.1%)
Households’ gross disposable income (GDI) decelerated in Q4 2015 (+0.4% after +0.6%). However, wages earned by households accelerated in Q4 (+0.6% after +0.4%), as the average wage per capita paid by non-financial corporations (+0.4% after +0.2%). Social benefits in cash accelerated slightly too (+0.5% after +0.3% in Q3). Taxes on income and wealth rebounded in Q4 (+2.0%) as a backlash against the downturn in Q3 (−1.3%) linked to tax measures lowering taxes for modest income households in 2015 (abolition of the first income tax bracket and adjustment of tax relief).
tableauTab3 – Production. consumption and GFCF: main components
| 2015 Q1 | 2015 Q2 | 2015 Q3 | 2015 Q4 | 2014 | 2015 | |
|---|---|---|---|---|---|---|
| Production of branches | 0.8 | -0.1 | 0.4 | 0.5 | 0.7 | 1.4 |
| Goods | 1.4 | -0.6 | 0.4 | 0.7 | 0.1 | 1.5 |
| Manufactured Industry | 1.2 | -0.4 | 0.4 | 1.0 | 0.3 | 1.7 |
| Construction | -0.6 | -0.9 | -0.8 | 0.2 | -2.2 | -2.8 |
| Market services | 0.7 | 0.3 | 0.6 | 0.5 | 1.2 | 2.0 |
| Non-market services | 0.2 | 0.3 | 0.3 | 0.4 | 1.3 | 1.2 |
| Household consumption | 0.6 | 0.0 | 0.4 | -0.1 | 0.6 | 1.4 |
| Food products | 0.2 | 0.7 | -0.1 | 0.4 | 0.2 | 1.1 |
| Energy | 3.7 | -2.6 | 1.6 | -2.3 | -5.7 | 1.7 |
| Engineered goods | 1.0 | 0.1 | 1.0 | -0.4 | 1.9 | 2.5 |
| Services | 0.3 | 0.2 | 0.2 | 0.2 | 0.7 | 1.0 |
| GFCF | 0.4 | -0.1 | 0.1 | 0.7 | -1.2 | 0.0 |
| Manufactured goods | 1.3 | 0.1 | 1.3 | 2.5 | 1.3 | 2.3 |
| Construction | -0.7 | -1.0 | -0.8 | -0.2 | -3.4 | -3.3 |
| Market services | 1.3 | 1.1 | 0.4 | 0.7 | 0.4 | 3.0 |
- Source: INSEE
In parallel, household consumption prices were stable in Q4 2015 (after −0.2%). Thus, households’ purchasing power slowed down (+0.4% after +0.9%). However, over the year, it accelerated (+1.8% after +1.1% in 2014). Measured per consumption unit, it increased by 1.3% in 2015 after 0.7% in 2014.
As households’ consumption decreased slightly in volume terms while their purchasing power increased, their saving ratio rose in Q4: it climbed to 15.9% of their GDI, its highest level since mid-2011, after 15.5% in Q3. On average over the year, it increased too, from 15.1% to 15.4%.
Non-financial corporations’ profit ratio kept on increasing and reached 31.4% in Q4 2015
In Q4 2015, non-financial corporations’ profit ratio kept on climbing (+0.4 points, at 31.4%), hitting its highest level since 2011: it is mainly buoyed by the decrease in energy prices which improved the terms of trade. However, real wages increased more than productivity gains, which curbed the rise of profit ratio.
General government deficit decreased again in Q4
General government net borrowing decreased by 1.0 points of GDP in Q4, and reached −2.8% after −3.8% in Q3. Over the year, it accounts for 3.5% of GDP, which is coherent with the first annual account estimate notified to the European Commission.
Spending decreased in Q4. Indeed, government debt servicing fell back because the price slowdown has reduced interests on inflation-linked government bonds. A significant diminution of French contribution to European budget also contributed to expenditure decrease. Besides, revenue accelerated in Q4, thanks to the sharp rebound in tax on income and wealth paid by corporates and households.
Revisions
GDP growth in Q4 is confirmed at +0.3% in Q4 2015. Slight revisions of various aggregates offset each other; they are mainly due to revisions of indicators and to updating of seasonal adjustement coefficients. They lead to enhance very slightly the annual average GDP growth (which now rounds at +1.2% over the year).
tableauTab4 – Households’ disposable income and ratios of households’ account
| 2015 Q1 | 2015 Q2 | 2015 Q3 | 2015 Q4 | 2014 | 2015 | |
|---|---|---|---|---|---|---|
| HDI | 0.9 | 0.1 | 0.6 | 0.4 | 1.1 | 1.7 |
| Household purchasing power | 1.0 | -0.2 | 0.9 | 0.4 | 1.1 | 1.8 |
| HDI by cu* (purchasing power) | 0.9 | -0.3 | 0.7 | 0.3 | 0.7 | 1.3 |
| Adjusted HDI (purchasing power) | 0.8 | -0.1 | 0.7 | 0.4 | 1.3 | 1.7 |
| Saving rate (level) | 15.3 | 15.1 | 15.5 | 15.9 | 15.1 | 15.4 |
| Financial saving rate (level) | 6.3 | 6.2 | 6.6 | 7.1 | 6.0 | 6.6 |
- *cu: consumption unit
- Source: INSEE
tableauTab5 – Ratios of non-financial corporations’ account
| 2015 Q1 | 2015 Q2 | 2015 Q3 | 2015 Q4 | 2014 | 2015 | |
|---|---|---|---|---|---|---|
| Profit share | 30.9 | 30.8 | 31.1 | 31.4 | 29.5 | 31.0 |
| Investment ratio | 22.9 | 23.0 | 23.0 | 23.0 | 23.1 | 23.0 |
| Savings ratio | 19.1 | 19.4 | 20.2 | 19.9 | 17.4 | 19.6 |
| Self-financing ratio | 83.4 | 84.2 | 87.8 | 86.6 | 75.2 | 85.5 |
- Source: INSEE
tableauTab6 – Expenditure. receipts and net borrowing of public administrations
| 2015 Q1 | 2015 Q2 | 2015 Q3 | 2015 Q4 | 2014 | 2015 | |
|---|---|---|---|---|---|---|
| In billions of euros | ||||||
| Total expenditure | 309.5 | 312.1 | 311.5 | 310.3 | 1226.8 | 1243.3 |
| Total receipts | 290.1 | 290.8 | 290.4 | 294.7 | 1141.8 | 1165.9 |
| Net lending (+) or borrowing (-) | -19.4 | -21.3 | -21.0 | -15.6 | -85.0 | -77.4 |
| In % of GDP | ||||||
| Net lending (+) or borrowing (-) | -3.6 | -3.9 | -3.8 | -2.8 | -4.0 | -3.5 |
- Source: INSEE
tableauTab2 – Sectoral accounts
| 2015 Q1 | 2015 Q2 | 2015 Q3 | 2015 Q4 | 2014 | 2015 | |
|---|---|---|---|---|---|---|
| Profit ratio of NFC* (level) | 30.9 | 30.8 | 31.1 | 31.4 | 29.5 | 31.0 |
| Household purchasing power | 1.0 | -0.2 | 0.9 | 0.4 | 1.1 | 1.8 |
- *NFC: non-financial corporations
- Source: INSEE
Avertissement
Quarterly national accounts
Quarterly debt of the general government
Sources
Quarterly national accounts
Quarterly accounts are a consistent set of indicators which provides a global overview of recent economic activity.
Time series of the main aggregates of quarterly national accounts can be accessed through the "Summary". They are classified into eight categories:
- Gross domestic product (GDP) and main economic aggregates ;
- Goods and services ;
- Households' consumption ;
- Foreign trade ;
- Activities ;
- Institutional sectors ;
- Households' income and purchasing power ;
- Public finances.
For each category, are available :
- synthetic files displaying from the accounts the relevant information for economic analysis ,
- sometimes, one or two files displaying all the data available.
Documentation
Abbreviated methodology (pdf, 140 Ko )
Methodology - First estimate at 30 days (pdf, 112 Ko )