


 17 March 2016
2016- n° 66Near stability in business start-ups in February 2016 Enterprise births - February 2016
17 March 2016
2016- n° 66Near stability in business start-ups in February 2016 Enterprise births - February 2016
In February 2016, the number of business births was almost unchanged (–0.1% following +1.4% for all entreprises, seasonally and working-day adjusted). The downturn in start-ups excluding self-managed micro-entrepreneurs (–1.7%) was offset by a new rise in micro-entrepreneurs’ registrations (+2.2%).
In February 2016, the number of business births was almost unchanged (–0.1% following +1.4% for all entreprises, seasonally and working-day adjusted). The downturn in start-ups excluding self-managed micro-entrepreneurs (–1.7%) was offset by a new rise in micro-entrepreneurs’ registrations (+2.2%).
graphiqueGraph1EN – Business start-ups (SA-WDA *)
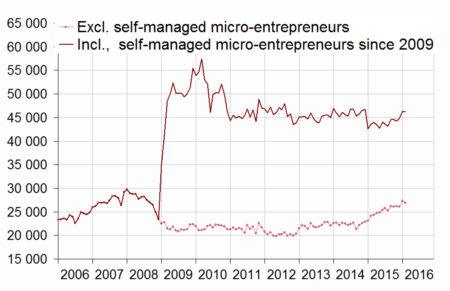
- * Seasonally and working-day adjusted data
- Source: INSEE (Sirene)
tableautab1EN – Business set-ups by month (SA-WDA *)
| Nov. 2015 | Dec. 2015 | Jan. 2016 | Feb. 2016 | ||||
|---|---|---|---|---|---|---|---|
| Excl. self-managed micro-entrepreneurs | 26,164 | 26,083 | 27,340 | 26,879 | |||
| Variation [m-o-m] % | 0.3 | -0.3 | 4.8 | -1.7 | |||
| Incl. self-managed micro-entrepreneurs | 44,285 | 44,864 | 46,269 | 46,220 | |||
| Variation [m-o-m] % | -0.6 | 1.3 | 3.1 | -0.1 | |||
- * Seasonally and working-day adjusted data
- Source: INSEE (Sirene)
+3.5% year-on-year (quarterly basis)
The raw amount of births added up in the last three months went up by 3.5% compared to the same months one year before. Over this period, company set-ups (+12.5%) and even more sole proprietorship start-ups excluding self-managed micro-entrepreneurs (+17.2%) shoot up. By contrast, micro-entrepreneur’s registrations fell by 9.8% over the same period. Transportation was the sector that most contributed to the overall rise1.
tableautab2EN – Business start-ups by type
| Moving total % change * | Moving total | Moving total | ||
|---|---|---|---|---|
| over 3 months | over 12 months | January- February 2016 | January- February 2015 | |
| Total | 3.5 | −2.1 | 97,282 | 91,889 |
| Companies | 12.5 | 6.8 | 33,066 | 28,774 |
| Sole proprietorships | −0.8 | −6.0 | 64,216 | 63,115 |
| Excluding self-managed micro-entrepreneurs | 17.2 | 28.2 | 25,101 | 22,123 |
| Self-managed micro-entrepreneurs | −9.8 | −19.0 | 39,115 | 40,992 |
- * Total of business start-ups during the last 3 or 12 months compared with the same months a year earlier
- Source: INSEE (Sirene)
−2.1% year-on-year (twelve months basis)
The raw number of business start-ups totted up during the last twelve months was down by 2.1% year-on-year due to the sharp drop of self-managed micro-entrepreneurs’ set-ups (−19.0%). Conversely, sole proprietorships creations excluding self-managed micro-entrepreneurs took off (+28.2%) and companies’ start-ups increased markedly by 6.8%.
The share of self-managed micro-entrepreneur’s registrations has continued to decrease
In February 2016, micro–entrepreneurs’ registrations amounted to 41.8% of business set-ups over the twelve last months. One year before, the share was 50.5%.
tableautab0EN – Business set-ups distribution by type
| Dec. 2015 | Jan. 2016 | Feb. 2016 | |
|---|---|---|---|
| Companies | 32.8 | 33.0 | 33.2 |
| Sole proprietorships excluding self-managed micro-entrepreneurs | 24.7 | 24.9 | 25.0 |
| Self-managed micro-entrepreneurs | 42.6 | 42.1 | 41.8 |
- Source: INSEE (Sirene)

1 The contribution of a sector to the overall variation is the observed variation of this sector, weighted by the share of this sector in the total number of births.
graphiqueGraph2EN – Trade and business support activities start-ups (SA-WDA *)
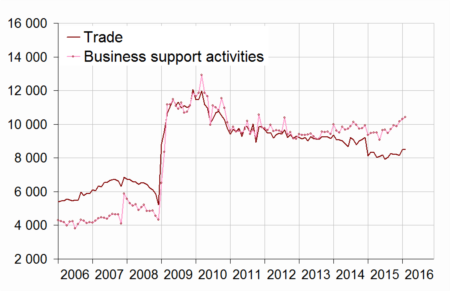
- * Seasonally and working-day adjusted data
- Source : Insee, Sirene
graphiqueGraph3EN – Construction and real estate business set-ups (SA-WDA *)
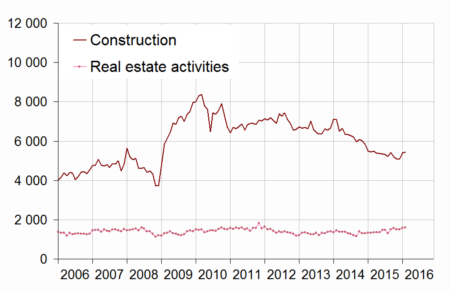
- * Seasonally and working-day adjusted data
- Source : Insee, Sirene
tableautab3EN – Number of business set-ups (incl. self-managed micro-enterprises)
| NA | Dec. 2015 | Jan. 2016 | Feb. 2016 | |
|---|---|---|---|---|
| Total | 44,864 | 46,269 | 46,220 | |
| Industry | BE | 1,948 | 2,050 | 1,947 |
| Of which Manufacturing | C | 1,725 | 1,809 | 1,674 |
| Construction | FZ | 5,067 | 5,407 | 5,441 |
| Wholesale and retail trade, Transport, Accommodation and Food and beverage activities | GI | 13,235 | 13,278 | 13,357 |
| Of which Trade | G | 8,143 | 8,485 | 8,489 |
| Of which Transportation and storage | H | 2,522 | 2,385 | 2,522 |
| Of which Accommodation and food service activities | I | 2,387 | 2,480 | 2,480 |
| Information and communication | JZ | 2,190 | 2,293 | 2,325 |
| Financial and insurance activities | KZ | 1,163 | 1,289 | 1,385 |
| Real estate activities | LZ | 1,507 | 1,584 | 1,592 |
| Business support activities | MN | 10,167 | 10,320 | 10,436 |
| Public administration and defence, education, human health and social work activities | OQ | 5,505 | 5,780 | 5,597 |
| Other services activities | RS | 4,082 | 4,268 | 4,140 |
- * Seasonally and working-day adjusted data
- Source: INSEE (Sirene)
tableautab3bisEN – Fluctuation in the number of business set-ups (incl. self-managed micro-entrepreneurs)
| NA | Feb. 16 / Jan. 16 | Moving total % change** | ||
|---|---|---|---|---|
| SA-WDA* | over 3 months | over 12 months | ||
| Total | −0.1 | 3.5 | −2.1 | |
| Industry | BE | −5.0 | −6.9 | −13.2 |
| Of which Manufacturing | C | −7.5 | −7.7 | −15.4 |
| Construction | FZ | 0.6 | −5.8 | −12.9 |
| Wholesale and retail trade, Transport, Accommodation and Food and beverage activities | GI | 0.6 | 10.9 | 0.7 |
| Of which Trade | G | 0.1 | −0.6 | −6.9 |
| Of which Transportation and storage | H | 5.7 | 103.8 | 62.3 |
| Of which Accommodation and food service activities | I | 0.0 | 2.0 | −3.1 |
| Information and communication | JZ | 1.4 | 2.7 | −2.2 |
| Financial and insurance activities | KZ | 7.4 | 2.2 | 8.8 |
| Real estate activities | LZ | 0.5 | 18.3 | 12.2 |
| Business support activities | MN | 1.1 | 6.4 | 0.6 |
| Public administration and defence, education, human health and social work activities | OQ | −3.2 | 0.1 | 1.9 |
| Other services activities | RS | −3.0 | −5.4 | −7.7 |
- * Seasonally and working-day adjusted data
- ** Total of business start-ups during the last 3 or 12 months compared with the same months a year earlier
- Source: INSEE (Sirene)
Pour en savoir plus
Time series : Business demography
