


 31 March 2016
2016- n° 87In January 2016, the turnover declined again in the manufacturing industry (–1.1%) Turnover in industry and construction - January 2016
31 March 2016
2016- n° 87In January 2016, the turnover declined again in the manufacturing industry (–1.1%) Turnover in industry and construction - January 2016
In January 2016, the turnover fell again in the manufacturing industry (-1.1%, after -1.6% in December). Exports declined more sharply (-2.6%, after -0.7%).

Warning: from this release, the turnover index series are produced according to a new methodology that improves their quality. The series have been recalculated over the period 1999-2015. Further information concerning these changes is available on the Web page of this index.
In January 2016, the turnover fell again in the manufacturing industry (−1.1%, after −1.6% in December). Exports declined more sharply (−2.6%, after −0.7%).
In the industry as a whole, the turnover continued to decrease as well (−1.1%, after −1.5%).
Rise over the last three months (+0.7%)
Over the last three months, the turnover went up in the manufacturing industry (+0.7%). The growth was mainly driven by the manufacture of transport equipment (+4.5%), even the turnover rose also in other manufacturing (+0.3%). Conversely, it dropped sharply in the manufacture of coke and refined petroleum products (−4.1%). It remained virtually stable in the manufacture of food products and beverages (+0.1%) and in the electrical and electronic equipment, and machine equipment (−0.1%).
In the industry as a whole (+0.2%), the turnover barely rose, curtailed by a fall in the mining and quarrying; energy; water supply (−2.0%).
Increase over the last year (+1.4%)
In the manufacturing industry, the turnover went up substantially over the last three months, compared to the same three months of previous year (+1.4%, y-o-y). It climbed at virtually the same pace in the industry as a whole (+1.6%).
Over this period, the turnover improved considerably in the manufacture of transport equipment (+10.4%), and more moderately in other manufacturing (+1.1%), in the manufacture of food products and beverages (+0.9%) and in the electrical and electronic equipment; machine equipment (+0.9%). However, it slumped in the manufacture of coke and refined petroleum products (−17.9%) with the dramatic fall in producer prices.
graphiqueIRgraph3 – Turnover in manufacturing industry
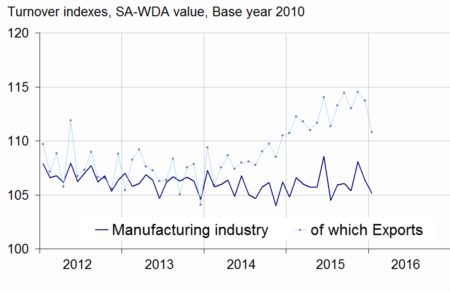
- Source: INSEE
graphiqueIRGraph4 – Turnover in manufacturing industry by sector
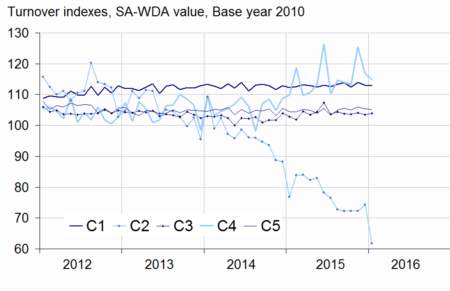
- Source: INSEE
tableauIRtab5 – Variation of the turnover in industry and construction
| Change in % | |||||
|---|---|---|---|---|---|
| NA: A 10, (A 17) | Weight** | Jan./ Dec. | Dec./ Nov. | q-o-q (1) | y-o-y (2) |
| BE: INDUSTRY | 10000 | –1.1 | –1.5 | 0.2 | 1.6 |
| CZ: MANUFACTURING INDUSTRY | 8346 | –1.1 | –1.6 | 0.7 | 1.4 |
| Of which Exports | 2677 | –2.6 | –0.7 | –0.5 | 2.8 |
| (C1): Manufacture of food products and beverages | 1685 | –0.2 | –0.8 | 0.1 | 0.9 |
| (C2): Manufacture of coke and refined petroleum products | 561 | –16.8 | 2.8 | –4.1 | –17.9 |
| (C3): Electrical and electronic equipment; machine equipment | 953 | 0.5 | –0.7 | –0.1 | 0.9 |
| (C4): Manufacture of transport equipment | 1265 | –1.6 | –6.9 | 4.5 | 10.4 |
| (C5): Other manufacturing | 3881 | –0.1 | –0.6 | 0.3 | 1.1 |
| DE: Mining and quarrying; energy; water supply; waste management | 1654 | –1.2 | –1.0 | –2.0 | 2.5 |
| FZ: CONSTRUCTION | 10000 | –0.3 | –1.2 | 0.1 | –0.3 |
- ** 10000=B...E and F
- (1) Quarter-on-quarter: last three months / previous three months
- (2) Year-on-year: last three months / same three months of previous year
- The codes correspond to different levels of aggregation of the NACE classification.
- Source: INSEE
Crash in refined petroleum products (−16.8%)
In January 2016, the turnover in the manufacture of coke and refined petroleum products plummeted (−16.8%), after a rise in December 2015 (+2.8%).
Drop in transport equipments (−1.6%)
The turnover fell again in January in the manufacture of transport equipment (−1.6%), but less than in December (−6.9%). It went down sharply in the manufacture of motor vehicles, trailers and semi-trailers (−3,8%, as in December), while it picked up slightly in the manufacture of other transport equipments (+0.4%, after −9.5%).
Slight rebound in electrical and electronic equipments (+0.5%)
In January, the turnover bounced back in the electrical and electronic equipment, and machine equipment (+0.5%, after −0.7%): it rebounded in the manufacture of computer, electronic and optical products (+2.1%, after −1.2%) and in the manufacture of machinery and equipment n.e.c. (+0.9%, after −0.1%), but it dropped again in the manufacture of electrical equipment (−2.4%, after −1.1%).
Very slight decrease in food products and beverages (−0.2%)
In January, the turnover fell a little further in the manufacture of food products and beverages (−0.2%, after −0.8% in December).
Very slight fall in other manufacturing (−0.2%)
The turnover in other manufacturing declined very slightly in January (−0.2%, after −0.6%). It dropped in the manufacture of basic pharmaceutical products and pharmaceutical preparations (−5.1%) and more moderately in the manufacture of rubber and plastic products (−1.5%). Conversely, it grew mainly in the manufacture of basic metals and fabricated metal products (+2.4%) and in other manufacturing (+1.1%).
Revisions: all series recalculated according to a new methodology
In the manufacturing industry as in the industry as a whole, the revisions are larger than usual, due to the change of methodology (see the Warning).
tableauIRtab8 – Indexes of turnover in industry and construction
| Change in % | |||||
|---|---|---|---|---|---|
| Industries: | Weight* | Jan. 2016 | Jan./ Dec. | Dec./ Nov. | q-o-q (1) |
| BE: INDUSTRY | 10000 | 106.4 | –1.1 | –1.5 | 0.2 |
| CZ: MANUFACTURING INDUSTRY | 8346 | 105.2 | –1.1 | –1.6 | 0.7 |
| of which Exports | 2677 | 110.8 | –2.6 | –0.7 | –0.5 |
| (C1): Man. of food products and beverages | 1685 | 112.9 | –0.2 | –0.8 | 0.1 |
| of which Exports | 285 | 115.6 | 0.8 | –2.5 | 0.6 |
| (C2): Man. of coke and refined petroleum products | 561 | 61.8 | –16.8 | 2.8 | –4.1 |
| (C3): Electrical and electronic equipment; machine equipment | 953 | 103.9 | 0.5 | –0.7 | –0.1 |
| of which Exports | 469 | 102.5 | 0.3 | –0.5 | –1.9 |
| [CI] Man. of computer, electronic and optical products | 306 | 102.4 | 2.1 | –1.2 | 0.8 |
| [CJ] Man. of electrical equipment | 245 | 95.4 | –2.4 | –1.1 | –1.5 |
| [CK] Man. of machinery and equipment n.e.c. | 402 | 110.2 | 0.9 | –0.1 | 0.0 |
| (C4): Man. of transport equipment | 1265 | 114.9 | –1.6 | –6.9 | 4.5 |
| of which Exports | 617 | 123.7 | –6.3 | –1.2 | 1.9 |
| [CL1] Man. of motor vehicles, trailers and semi-trailers | 702 | 95.5 | –3.8 | –3.8 | 0.0 |
| [CL2] Man. of other transport equipment | 562 | 139.1 | 0.4 | –9.5 | 8.6 |
| (C5): Other manufacturing | 3881 | 105.2 | –0.2 | –0.6 | 0.3 |
| of which Exports | 1237 | 109.0 | –0.6 | –1.0 | –1.6 |
| [CB] Man. of textiles, wearing apparel, leather and related products | 188 | 108.4 | –1.1 | –0.5 | 1.2 |
| [CC] Man. of wood and paper products; printing and reproduction of recorded media | 436 | 97.9 | –0.3 | –1.2 | 1.5 |
| [CE] Man. of chemicals and chemical products | 745 | 102.2 | –1.1 | 3.2 | –0.8 |
| [CF] Man. of basic pharmaceutical products and pharmaceutical preparations | 304 | 107.2 | –5.1 | 3.5 | –0.1 |
| [CG] Man. of rubber and plastics products, and other non-metallic mineral products | 629 | 102.8 | –1.5 | –1.8 | 1.7 |
| [CH] Man. of basic metals and fabricated metal products, except machinery and equipment | 926 | 102.7 | 2.4 | –3.3 | –0.3 |
| [CM] Other manufacturing; repair and installation of machinery and equipment | 653 | 117.6 | 1.1 | –1.4 | 0.4 |
| DE: Mining and quarrying; energy, water supply, sewerage, waste management | 1654 | 112.8 | –1.2 | –1.0 | –2.0 |
| [BZ] Mining and quarrying | 70 | 95.2 | 0.5 | 0.9 | 3.7 |
| [DZ] Electricity, gas, steam and air-conditioning supply | 1205 | 115.6 | –0.7 | –1.1 | –2.6 |
| [EZ] Water supply; sewerage, waste management and remediation | 379 | 107.0 | –3.0 | –1.0 | –0.7 |
| FZ: CONSTRUCTION | 10000 | 102.9 | –0.3 | –1.2 | 0.1 |
- ** 10000=B...E and F
- (1) Quarter-on-quarter: last three months / previous three months
- Source: INSEE
tableauIRtab7 – Measure of variations' revisions
| Dec./ Nov. | Nov./ Oct. | Oct./ Sep. | Q4 2015/ Q3 2015 | 2015/ 2014 | |
|---|---|---|---|---|---|
| Industry (BE) | –0.53 | –1.08 | 0.43 | 0.95 | 0.53 |
| raw serie | 2.78 | 3.25 | –1.52 | 3.64 | 0.16 |
| SA-WDA coeff. | –3.31 | –2.17 | 1.95 | –2.69 | 0.37 |
| Manufacturing industry (CZ) | –0.54 | 1.29 | 0.36 | 1.45 | 0.27 |
| raw serie | 3.69 | 3.50 | –1.75 | 4.77 | –0.16 |
| SA-WDA coeff. | –4.22 | –2.21 | 2.11 | –3.32 | 0.43 |
- How to read it: in the manufacturing industry, the SA-WDA variation between November and December 2015 has been revised by –0.54 points: +3.69 points are due to the raw serie's revision and –4.22 points to the new calculation of the SA-WDA.
- Source: INSEE
Documentation
Methodology (pdf,140 Ko)
Pour en savoir plus
Time series : Turnover indices (VAT)
