


 16 February 2016
2016- n° 40In January 2016, oil prices plummeted again Prices of oil and raw material imports - January 2016
16 February 2016
2016- n° 40In January 2016, oil prices plummeted again Prices of oil and raw material imports - January 2016
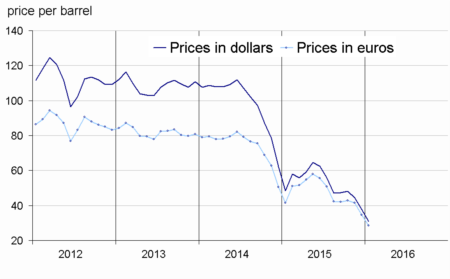
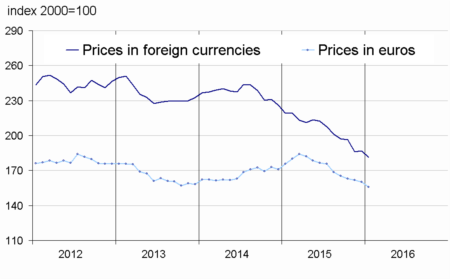
In January 2016, the crude oil price in euros slumped again (-18.0% after -16.4% in December). Standing at €28.4 on average per barrel of Brent, this price crashed by 31.8% compared to its level in January 2015 (€41.6), hitting its lowest level since December 2004. Prices in euros of the other imported commodities declined again (-2.6% after -1.0%), whether for raw food materials (-2.6%) or industrial raw materials (-2.3%).
In January 2016, the crude oil price in euros slumped again (−18.0% after −16.4% in December). Standing at €28.4 on average per barrel of Brent, this price crashed by 31.8% compared to its level in January 2015 (€41.6), hitting its lowest level since December 2004. Prices in euros of the other imported commodities declined again (−2.6% after −1.0%), whether for raw food materials (−2.6%) or industrial raw materials (−2.3%).
Oil prices plunged
In January, the price of crude oil from the North Sea (Brent) in euros tumbled again (−18.0% after −16.4%). In effect, the supply remained significantly in excess and no agreement on output shrinkage began to be detectable while the lifting of sanctions against Iran implied a further increase in global production. The decrease in crude oil prices was a little more marked in dollars (−18.3% after −15.1%) because the euro depreciated slightly.
graphiqueG_petrole_ang – Oil (Brent)
- Source : INSEE
tableautabpetrole – Oil and petroleum productsin euros
| Prices | Change (%) | |||
|---|---|---|---|---|
| of last month | over the last month | over the last 3 months | over the last 12 months | |
| Brent in $ per barrel | 30.8 | –18.3 | –36.0 | –36.4 |
| Brent in € per barrel | 28.4 | –18.0 | –33.7 | –31.8 |
| Gasoline €/L | 0.25 | –12.1 | –18.4 | –11.0 |
| Gas Oil | 267.8 | –17.4 | –34.3 | –34.7 |
| Heavy fuel | 159.0 | –1.1 | –29.7 | –31.0 |
| Naphtha | 304.1 | –15.2 | –21.6 | –10.1 |
- Prices are in euros per tonne unless otherwise specified
- Source : INSEE
Prices of raw food materials kept declining
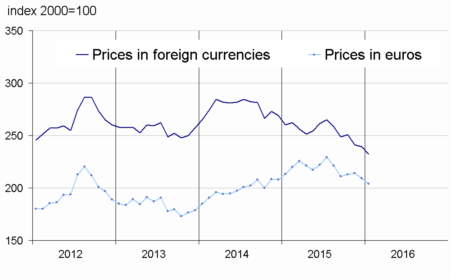
Prices of raw food materials in euros fell sharply again (−2.6% after −2.3%). The supply was plentiful while the demand slowed, in particular for oil seeds and vegetable oils (−1.3% after −6.3%). The downturn in tropical foodstuffs became more marked (−9.5% after −1.2%). Prices of sugar also fell further (−4.4% after −0.8%) due to higher yields in Brazil. The only exception was that the prices of beef meat accelerated (+6.2% after +3.7%).
graphiqueG_alim_ang – Food
- Source : INSEE
Prices of industrial raw materials continued to drop
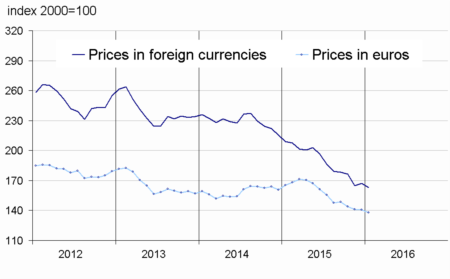
Prices of industrial raw materials in euros dipped (−2.3% after −0.1%).
Prices of minerals tightened (−1.9% after −0.1%). Prices of non-ferrous metals slipped back (−2.6% after +2.4%), as a result of a decelerating Chinese industrial activity and of an excess capactity of production. All the non-ferrous metals were involved, lead above all the others (−4.7% after +8.9%). However, prices of precious metals rallied (+0.4% after −2.5%), in particular gold (+3.0% after −2.8%) that played its part as a safe investment against the general background of falling equity markets. Finally, prices of iron ore bounced back (+4.5% after −15.5%), as a result of a demand recovery.
Prices of agricultural raw materials went down again (−2.8% after −1.3%; −12.2% year-on-year), in particular those of natural rubber (−7.2% after −1.5%) and tropical wood (−3.5% after −2.9%).
graphiqueG_indus_ang – Industrial raw materials
- Source : INSEE
graphiqueG_ensemble_ang – Imported raw materials (excluding energy)
- Source : INSEE
tableautabmatprem_ang – Imported raw materials (excluding energy) in euros
| Index | Changes (%) | |||
|---|---|---|---|---|
| over the last month | over the last 3 months | over the last 12 months | ||
| Food total | 204.0 | –2.6 | –4.1 | –4.3 |
| Tropical foodstuffs | 204.0 | –9.5 | –5.5 | 1.5 |
| Oil seeds, vegetable oils | 210.4 | –1.3 | –9.9 | –11.7 |
| Cereals | 148.8 | –0.1 | 0.7 | –3.8 |
| Sugar | 147.5 | –4.4 | 4.6 | 1.7 |
| Beef meat | 169.4 | 6.2 | 6.0 | –1.3 |
| Industrial raw materials | 137.7 | –2.3 | –4.4 | –16.6 |
| Agricultural raw materials | 106.2 | –2.8 | –0.8 | –12.2 |
| Natural Fibres | 121.8 | –1.4 | 3.7 | 9.9 |
| Natural rubber | 110.0 | –7.2 | –11.9 | –32.1 |
| Hides | 78.5 | 4.0 | 4.3 | –23.6 |
| Wood pulp | 99.3 | –1.4 | –1.0 | –8.6 |
| Tropical wood | 110.8 | –3.5 | –2.7 | 1.9 |
| Sawn softwood | 86.0 | –2.8 | 3.4 | –14.9 |
| Minerals | 154.9 | –1.9 | –5.8 | –18.2 |
| Iron ore | 281.5 | 4.5 | –19.0 | –34.4 |
| Non-ferrous metals | 132.8 | –2.6 | –3.3 | –15.6 |
| Precious metals | 211.8 | 0.4 | –7.3 | –14.5 |
| All commodities | 155.8 | –2.6 | –4.4 | –11.4 |
- Source : INSEE
Pour en savoir plus
Time series : Raw materials prices
