


 17 May 2016
2016- n° 128In April 2016, oil prices slackened Prices of oil and raw material imports - April 2016
17 May 2016
2016- n° 128In April 2016, oil prices slackened Prices of oil and raw material imports - April 2016
In April 2016, the crude oil price in euros slowed (+6.1%) after a substantial hike in March (+17.3%). Since February, the rise in price only partly offset the past downward trend: standing at €38.1 on average per barrel of Brent, this price was 32.1% lower than one year ago.
In April 2016, the crude oil price in euros slowed (+6.1%) after a substantial hike in March (+17.3%). Since February, the rise in price only partly offset the past downward trend: standing at €38.1 on average per barrel of Brent, this price was 32.1% lower than one year ago.
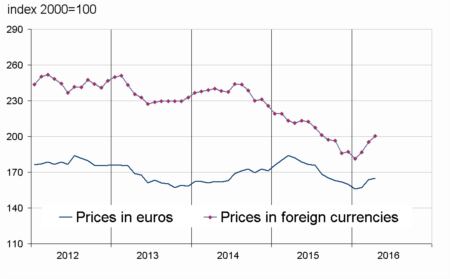
Prices in euros of the other imported commodities slowed down as well (+0.8% after +4.2%). In effect, industrial raw materials prices decelerated (+1.7% after +6.2%) and raw food materials prices edged down (−0.5% after +1.9%).
Oil prices increased again but less than in March
In April, the price of crude oil from the North Sea (Brent) in euros climbed again (+6.1%), but less vigourously than in March (+17.3%). In dollars, the price rise was stronger (+8.1% after +17.7%) since the euro appreciated during the month.
graphiqueG_petrole_ang – Oil (Brent)

- Source: INSEE
tableautabpetrole – Oil and petroleum products
| Prices | Change (%) | |||
|---|---|---|---|---|
| of last month | over the last month | over the last 3 months | over the last 12 months | |
| Brent in $ per barrel | 42.3 | 8.1 | 37.2 | –28.9 |
| Brent in € per barrel | 37.3 | 6.1 | 31.2 | –32.1 |
| Gasoline €/L | 0.34 | 18.3 | 34.4 | –19.7 |
| Gas Oil | 326.3 | 2.2 | 21.9 | –37.0 |
| Heavy fuel | 191.4 | 17.3 | 20.3 | –43.7 |
| Naphtha | 327.0 | 5.7 | 7.6 | –30.9 |
- Prices are in euros per tonne unless otherwise specified.
- Source: INSEE
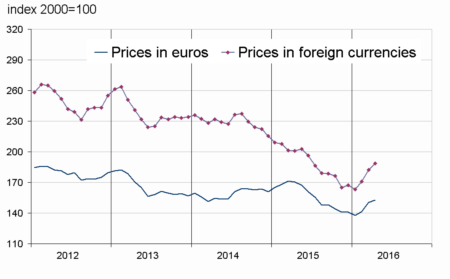
Prices of industrial raw materials slowed
Prices of industrial raw food materials in euros grew again, but not as strongly as in March (+1.7% after +6.2%) due to the deceleration in agricultural raw materials prices (+1.2% after +6.0%) and mineral prices (+1.8% after +6.6%). As for agricultural raw materials, the further rise in natural rubber prices (+17.2% after +19.9%) due to a severe drought in South-East Asia was partially offset by the fall in other commodities, in particuler wood pulp (−1.9% after −0.7%).
Among minerals, the price of iron ore slackened sharply (+5.3% after +19.8%). Those of precious metals were less buoyant (+2.2% after +3.3%). The price of gold, in particular, declined (−2.0% after +3.2%), due to lessening demand in electronics industry.
graphiqueG_indus_ang – Industrial raw materials
- Source: INSEE
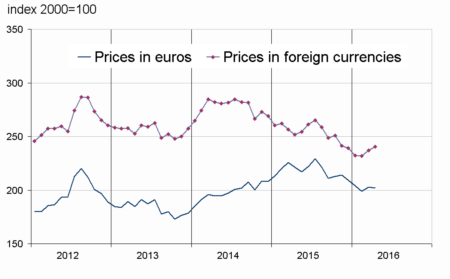
Prices of raw food materials slipped back
Prices of raw food materials in euros faltered in April (−0.5% after +1.9%). On the one hand, sugar price fell back significantly (−4.6% after +15.5%), as a result of a crop that was not as bad as forecast in Brazil and of a downward trend in ethanol demand faced with petroleum-based fuels whose prices remained low. Furthermore, the price of beef meat dipped sharply (−8.2% after +1.2%) and prices of tropical foodstuffs shrank (−2.1% after +4.0%).
graphiqueG_alim_ang – Food
- Source: INSEE
graphiqueG_ensemble_ang – Imported raw materials (excluding energy)
- Source: INSEE
tableautabmatprem – Imported raw materials (excluding energy) in euros
| Index | Changes (%) | |||
|---|---|---|---|---|
| of last month | over the last month | over the last 3 months | over the last 12 months | |
| Food total | 201.8 | –0.5 | –1.1 | –8.9 |
| Tropical foodstuffs | 198.7 | –2.1 | –2.6 | –4.3 |
| Oil seeds, vegetable oils | 220.7 | 4.9 | 4.9 | –7.9 |
| Cereals | 148.3 | 0.1 | –0.3 | –7.1 |
| Sugar | 148.1 | –4.6 | 0.4 | 10.7 |
| Beef meat | 150.9 | –8.2 | –10.9 | –20.9 |
| Industrial raw materials | 152.8 | 1.7 | 11.0 | –10.4 |
| Agricultural raw materials | 111.5 | 1.2 | 5.0 | –4.0 |
| Natural Fibres | 118.2 | 3.4 | –3.0 | –6.3 |
| Natural rubber | 157.8 | 17.2 | 43.5 | –6.4 |
| Hides | 73.8 | –2.2 | –6.0 | –29.4 |
| Wood pulp | 94.4 | –1.9 | –4.9 | –12.5 |
| Tropical wood | 105.2 | –1.2 | –5.0 | –8.6 |
| Sawn softwood | 94.9 | 0.4 | 10.4 | 8.9 |
| Minerals | 175.3 | 1.8 | 13.1 | –12.6 |
| Iron ore | 389.0 | 5.3 | 38.2 | 11.1 |
| Non-ferrous metals | 143.5 | 0.9 | 8.1 | –16.8 |
| Precious metals | 235.1 | 2.2 | 11.0 | –7.9 |
| All commodities | 165.0 | 0.8 | 5.9 | –9.4 |
- Source: INSEE
Pour en savoir plus
Time series : Raw materials prices
