


 13 May 2016
2016- n° 126Rebound in business start-ups in April 2016 Enterprise births - April 2016
13 May 2016
2016- n° 126Rebound in business start-ups in April 2016 Enterprise births - April 2016
In April 2016, the number of business births rebounded (+1.8% following -1.1% for all entreprises, seasonally and working-day adjusted). The micro-entrepreneurs' registrations picked up (+4.1%) and sole proprietorships excluding self-managed micro-entrepreneurs stabilised practically (+0.3%).
In April 2016, the number of business births rebounded (+1.8% following −1.1% for all entreprises, seasonally and working-day adjusted). The micro-entrepreneurs' registrations picked up (+4.1%) and sole proprietorships excluding self-managed micro-entrepreneurs stabilised practically (+0.3%).
graphiqueGraph1EN – Business start-ups (sa-wda *)
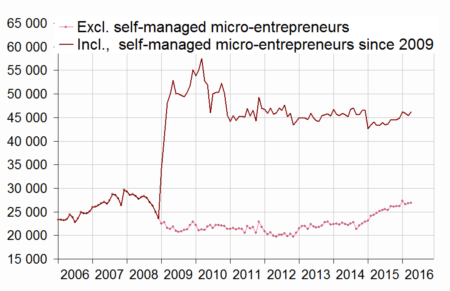
- * Seasonally and working-day adjusted data
- Source: INSEE (Sirene)
tableautab1EN – Business set-ups by month (sa-wda *)
| Jan. 2016 | Feb. 2016 | March 2016 | April 2016 | |
|---|---|---|---|---|
| Excl. self-managed micro-entrepreneurs | 27,284 | 26,617 | 26,812 | 26,887 |
| Variation [m-o-m] % | 4.1 | -2.4 | 0.7 | 0.3 |
| Incl. self-managed micro-entrepreneurs | 46,201 | 45,918 | 45,396 | 46,225 |
| Variation [m-o-m] % | 2.9 | -0.6 | -1.1 | 1.8 |
- * Seasonally and working-day adjusted data
- Source: INSEE (Sirene)
+5.8% year-on-year (quarterly basis)
The raw amount of births added up in the last three months went up clearly compared to the same period one year before (+5.8%), due to the companies (+12.7%) and sole proprietorship start-ups excluding self-managed micro-entrepreneurs (+9.0%). Over the same period micro-entrepreneur's registrations faltered by 1.3%. Transportation remained the sector that most contributed to the overall rise.1
tableautab2EN – Business start-ups by type
| Moving total % change * | Moving total | Moving total | ||
|---|---|---|---|---|
| over 3 months | over 12 months | January- April 2016 | January- April 2015 | |
| Total | 5.8 | -0.9 | 198,864 | 188,875 |
| Companies | 12.7 | 8.3 | 67,738 | 60,102 |
| Sole proprietorships | 2.5 | -4.9 | 131,126 | 128,773 |
| Of which excluding self-managed micro-entrepreneurs | 9.0 | 23.6 | 51,019 | 46,343 |
| Of which self-managed micro-entrepreneurs | -1.3 | -16.6 | 80,107 | 82,430 |
- * Total of business start-ups during the last 3 or 12 months compared with the same months a year earlier
- Source: INSEE (Sirene)
−0.9% year-on-year (twelve months basis)
The raw number of business start-ups totted up during the last twelve months decreased by 0.9% year-on-year. This drop was due to the significant fall in self-managed micro-entrepreneurs' set-ups (−16.6%). Conversely, sole proprietorships creations excluding self-managed micro-entrepreneurs grew sharply (+23.6%) as well as, albeit to a lesser extent, companies' start-ups (+8.3%).
Two business set-ups out of five are self-managed micro-entrepreneur's registrations
In April 2016, micro–entrepreneurs' registrations amounted to 41.3% of business set-ups over the twelve last months. One year before, the share was 49.2%.
tableautab0EN – Business set-ups distribution by type
| Feb. 2016 | March 2016 | April 2016 | |
|---|---|---|---|
| Companies | 33.2 | 33.4 | 33.6 |
| Sole proprietorships excluding self-managed micro-entrepreneurs | 25.0 | 25.1 | 25.1 |
| Self-managed micro-entrepreneurs | 41.8 | 41.5 | 41.3 |
- Source: INSEE (Sirene)

1 The contribution of a sector to the overall variation is the observed variation of this sector, weighted by the share of this sector in the total number of births.
Business set-ups by economic activity
graphiqueGraph2EN – Trade and business support activities start-ups (sa-wda *)
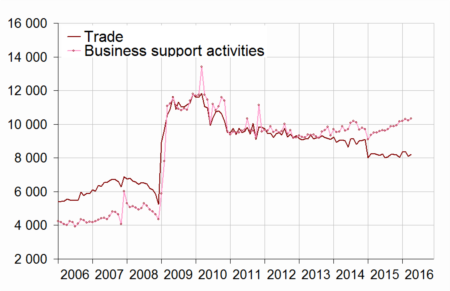
- Source: INSEE (Sirene)
graphiqueGraph3EN – Construction and real estate business set-ups (sa-wda *)
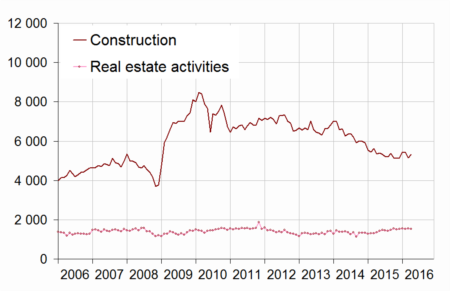
- * Seasonally and working-day adjusted data
- Source: INSEE (Sirene)
tableautab3EN – Number of business set-ups (incl. self-managed micro-enterprises)
| NA | Feb. 2016 | March 2016 | April 2016 | |
|---|---|---|---|---|
| Total | 45,918 | 45,396 | 46,225 | |
| Industry | BE | 1,979 | 2,069 | 2,007 |
| Of which Manufacturing | C | 1,768 | 1,832 | 1,809 |
| Construction | FZ | 5,415 | 5,149 | 5,323 |
| Wholesale and retail trade, Transport, Accommodation and Food and beverage activities | GI | 13,225 | 12,956 | 13,342 |
| Of which Trade | G | 8,389 | 8,102 | 8,202 |
| Of which Transportation and storage | H | 2,460 | 2,598 | 2,725 |
| Of which Accommodation and food service activities | I | 2,426 | 2,529 | 2,516 |
| Information and communication | JZ | 2,318 | 2,265 | 2,337 |
| Financial and insurance activities | KZ | 1,336 | 1,368 | 1,362 |
| Real estate activities | LZ | 1,525 | 1,562 | 1,525 |
| Business support activities | MN | 10,318 | 10,215 | 10,350 |
| Public administration and defence, education, human health and social work activities | OQ | 5,608 | 5,602 | 5,822 |
| Other services activities | RS | 4,195 | 4,209 | 4,159 |
- * Seasonally and working-day adjusted data
- Source: INSEE (Sirene)
tableautab3bisEN – Fluctuation in the number of business set-ups (incl. self-managed micro-entrepreneurs)
| NA | April 16 / March 16 | Moving total % change** | ||
|---|---|---|---|---|
| sa-wda * | over 3 months | over 12 months | ||
| Total | 1.8 | 5.8 | -0.9 | |
| Industry | BE | –3 | -0.1 | -10.7 |
| Of which Manufacturing | C | –1,2 | 2.1 | -12.0 |
| Construction | FZ | 3,4 | -2.7 | -10.8 |
| Wholesale and retail trade, Transport, Accommodation and Food and beverage activities | GI | 3 | 9.1 | 1.9 |
| Of which Trade | G | 1,2 | 0.3 | -5.8 |
| Of which Transportation and storage | H | 4,9 | 59.8 | 56.9 |
| Of which Accommodation and food service activities | I | –0,5 | 7.4 | -1.5 |
| Information and communication | JZ | 3,2 | 7.8 | -1.9 |
| Financial and insurance activities | KZ | –0,5 | 5.6 | 6.4 |
| Real estate activities | LZ | –2,4 | 16.7 | 15.0 |
| Business support activities | MN | 1,3 | 8.8 | 2.1 |
| Public administration and defence, education, human health and social work activities | OQ | 3,9 | 5.0 | 1.7 |
| Other services activities | RS | –1,2 | -0.5 | -6.5 |
- Source: INSEE (Sirene)
Pour en savoir plus
Time series : Business demography
