


 21 January 2016
2016- n° 15In the fourth quarter 2015, pressure on production capacity eased Quarterly business survey (goods-producing industries) - January 2016
21 January 2016
2016- n° 15In the fourth quarter 2015, pressure on production capacity eased Quarterly business survey (goods-producing industries) - January 2016
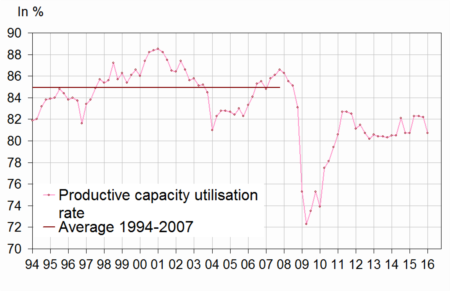
In January 2016, the industrialists have reported that pressure on production capacity eased. The production capacity utilisation rate has decreased by 1.5 point compared to the previous quarter. Since the third quarter of 2008, production capacity has been less used in the manufacturing industry than it was on average between 1994 and 2007.
Production capacity has declined
In January 2016, the industrialists have reported that pressure on production capacity eased. The production capacity utilisation rate has decreased by 1.5 point compared to the previous quarter. Since the third quarter of 2008, production capacity has been less used in the manufacturing industry than it was on average between 1994 and 2007.
Besides, an increasing number of industrialists consider that they could produce more if they received more orders: the balance on production bottlenecks has diminished and has returned to a level close to normal. Moreover, like in the previous quarter, far more industrialists have indicated difficulties of demand only than difficulties of supply only.
graphiqueGraphang2 – Change in the productive capacity utilisation
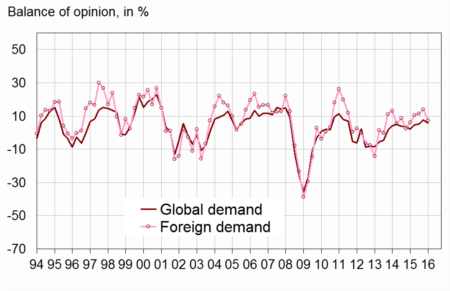
Industrialists remain optimistic on their demand prospects
In January 2016, a few less industrialists than in the end of 2015 judge that global demand has increased in the past months; the corresponding balance remain slightly above its mean level. That on foreign demand is virtually stable, slightly above its mean level. Over the next three months, a few less industrialists expect a further improvement in demand, and especially in foreign demand; however, the corresponding balances of opinion are still above average.
graphiqueGraphang1 – Balance of opinion of expected change in demand
tableautableau1 – Industrialists' opinion: demand and production factors
| Manufacturing industry | Mean | April 15 | July 15 | Oct. 15 | Jan. 16 |
|---|---|---|---|---|---|
| Global demand | |||||
| Past change | 0 | 3 | 3 | 4 | 2 |
| Future change | 1 | 5 | 5 | 7 | 6 |
| Foreign demand | |||||
| Past change | 3 | 7 | 9 | 3 | 4 |
| Future change | 5 | 10 | 11 | 14 | 7 |
| Production factors | |||||
| Production bottlenecks (in %) | 22 | 23 | 25 | 29 | 23 |
| Assessment of productive capacity | 14 | 14 | 20 | 16 | 13 |
| Production capacity utilisation rate (in %) | 84.5 | 82.3 | 82.3 | 82.2 | 80.7 |
| Difficulties of supply and demand | |||||
| Difficulties of supply and demand | 8 | 12 | 11 | 10 | 10 |
| Difficulties of supply | 20 | 14 | 21 | 15 | 14 |
| Difficulties of demand | 44 | 39 | 37 | 43 | 43 |
- * : Long-term average since 1976.
- The results of the last survey are preliminary.
- Source: INSEE - Quarterly business survey
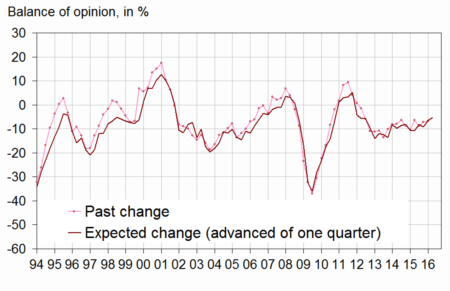
Balances on workforce are virtually stable
In January 2016, as many industrialists as in October have reported a decrease of the workforce during the past three months. Over the next few months, almost as many industrialists as in the previous quarter forecast job losses. Both balances have been above their long-term average since October 2013.
Three out of ten industrialists have experienced hiring difficulties; this part has been virtually stable since April 2013 close to its long-term average.
graphiqueGraphang3 – Workforce size in the manufacturing industry
Slight increase in wages
According to the business managers in the manufacturing industry, wages increased by 0.3% in the fourth quarter of 2015.
Since April 2015, the balance of opinion on working time has been virtually stable above its long-term average. A few more industrialists foresee a decrease in this working time over the next few months.
Smaller decline in selling prices
According to industrialists, selling prices in the manufacturing industry have dropped in Q4 2015 at a lower pace than in Q3 (−0.6% after −1.4%); they forecast a new decline for the next quarter (−0.4%).
Slightly fewer industrialists than in the previous quarter have experienced cash-flow problems (11%). This proportion stands below its mean level (15%).
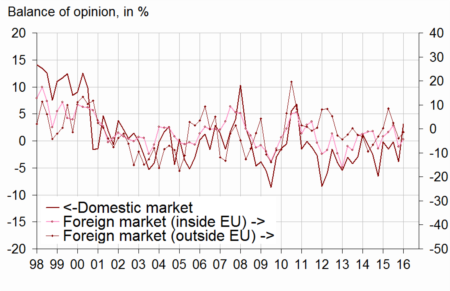
Improvement in the opinion on competitive position
In January 2016, more business managers judge that their competitive position has improved, in all markets. Only the balance on competitive position on foreign market inside European Union is still below its long-term average. Moreover, industrialists remain optimistic on general exportation prospects: the corresponding balance is virtually stable, significantly above its long period average.
graphiqueGraphang4 – Competitive position
tableautableau2 – Industrialists' opinion: employment, competitive position, cash-flow, wages and selling prices
| Manufacturing industry | Mean | April 15 | July 15 | Oct. 15 | Jan. 16 |
|---|---|---|---|---|---|
| Workforce size | |||||
| Past change | –11 | –6 | –9 | –7 | –7 |
| Expected change | –13 | –8 | –9 | –6 | –5 |
| Difficulties hiring | 28 | 27 | 29 | 29 | 29 |
| Working time | |||||
| Past change | –3 | 2 | 1 | 2 | 2 |
| Expected change | –5 | 0 | –1 | 2 | –1 |
| Cash-flow and wages | |||||
| Cash-flow problems | 15 | 12 | 13 | 13 | 11 |
| Past wages | 0,5 | 0.2 | 0.3 | 0.3 | 0.3 |
| Selling prices | |||||
| Past change | 0.1 | 1.0 | 0.1 | –1.4 | –0.6 |
| Expected change | 0.2 | –0.2 | –0.2 | –1.4 | –0.4 |
| Competitive position | |||||
| On domestic market | 1 | –2 | 0 | –4 | 3 |
| On foreign markets inside EU | –1 | –1 | 2 | –7 | –4 |
| On foreign markets outside EU | –1 | 9 | 2 | –4 | –1 |
| General exportation expectations | –10 | 7 | 5 | 4 | 3 |
- * : Long-term average since 1976.
- The results of the last survey are preliminary.
- A quantitative question is asked about selling prices and past wage.
- Source: INSEE - Quarterly business survey
Documentation
Methodology (pdf,48 Ko)
Pour en savoir plus
Time series : Industry
