


 15 January 2016
2016- n° 12In December 2015, oil prices tumbled again Prices of oil and raw material imports - December 2015
15 January 2016
2016- n° 12In December 2015, oil prices tumbled again Prices of oil and raw material imports - December 2015
In December 2015, the crude oil price in euros plunged (-16.4% after -3.3% in November). Standing at €34.6 on average per barrel of Brent, this price tumbled by 31.4% compared to its level in December 2014 (€50.5), hitting its lowest level since March 2009. Prices in euros of the other imported commodities declined afresh (-1.0% after -0.8%): this decrease was mainly due to raw food materials (-2.3%), while those of industrial raw materials were practically stable (-0.1%).
In December 2015, the crude oil price in euros plunged (−16.4% after −3.3% in November). Standing at €34.6 on average per barrel of Brent, this price tumbled by 31.4% compared to its level in December 2014 (€50.5), hitting its lowest level since March 2009. Prices in euros of the other imported commodities declined afresh (−1.0% after −0.8%): this decrease was mainly due to raw food materials (−2.3%), while those of industrial raw materials were practically stable (−0.1%).
Oil prices declined
In December, the price of crude oil from the North Sea (Brent) in euros tumbled (−16.4% after −3.3%). Actually, the supply remained significantly in excess despite the geopolitical tensions in the Middle East, and the stock levels were still plethoric in the United States. The downturn was less marked in dollars (−15.1% after −7.7%) because the euro appreciated in December.
Prices of industrial raw materials are virutally stable
Prices of industrial raw materials in euros were almost unchanged (−0.1% after −2.1%), due to those of minerals (−0.1% after –3.8%) which form the bulk of these imported commodities. On the one hand, prices of iron ore fell down again (−15.5% after −8.3%), on account of high inventories in China, and prices of precious metals dropped as well (−2.5% after −5.2%), in particular gold (−2.8%), and silver (−4.5%). On the other hand, prices of non-ferrous metals picked up (+2.4% after −3.0%), in particular some industrial metals such as copper (+0.7% after −6.2%), whose output stabilised, and lead whose prices accelerated (+8.9% after +1.6%).
Prices of agricultural raw materials fell back (−1.3% after +3.4% ; −3.2% year-on-year), in particular, prices of wood pulp (−3.2% after +3.7%) and tropical wood (−2.9% after +3.9%).
Prices of raw food materials declined
Prices of raw food materials in euros slipped back (−2.3% after +0.7%). Doubts over delayed crops in Brazil played a part in the price decrease of sugar (−0.8% after +10.3%). Prices of cereals fell back (−1.3% after +2.2%), due to a weak global demand, in particular for corn ; however, purchasing helped rice prices remain steady. Prices of oil seeds and vegetable oils decreased again (−6.3% after −2.6%), due to a high output of olive oil in particular. Last, the rise in beef meat prices (+3.7%) partly offset the decrease in the other foodstuffs.
tableautabpetrole – Oil and petroleum products
| Prices | Change (%) | |||
|---|---|---|---|---|
| of last month | over the last month | over the last 3 months | over the last 12 months | |
| Brent in $ per barrel | 37.7 | –15.1 | –20.1 | –39.3 |
| Brent in € per barrel | 34.6 | –16.4 | –17.7 | –31.4 |
| Gasoline €/L | 0.29 | –7.1 | –9.3 | –11.2 |
| Gas Oil | 324.3 | –20.2 | –22.7 | –30.3 |
| Heavy fuel | 160.7 | –26.8 | –27.5 | –34.0 |
| Naphtha | 358.6 | –8.6 | –2.4 | –13.2 |
- Prices are in euros per tonne unless otherwise specified
- Source : INSEE
tableautabmatprem – Imported raw materials (excluding energy) in euros
| Index | Changes (%) | |||
|---|---|---|---|---|
| of last month | over the last month | over the last 3 months | over the last 12 months | |
| Food total | 209.4 | –2.3 | –0.8 | 0.6 |
| Tropical foodstuffs | 225.4 | –1.2 | 4.6 | 18.3 |
| Oil seeds, vegetable oils | 213.2 | –6.3 | –10.1 | –12.0 |
| Cereals | 148.9 | –1.3 | 1.8 | 0.2 |
| Sugar | 154.3 | –0.8 | 36.5 | 13.2 |
| Beef meat | 159.5 | 3.7 | 3.5 | –2.7 |
| Industrial raw materials | 140.9 | –0.1 | –5.0 | –12.4 |
| Agricultural raw materials | 109.2 | –1.3 | 3.0 | –3.2 |
| Natural Fibres | 123.6 | –0.2 | 5.3 | 16.4 |
| Natural rubber | 118.5 | –1.5 | –3.4 | –27.1 |
| Hides | 75.5 | 2.3 | –2.8 | –24.4 |
| Wood pulp | 100.7 | –3.2 | –0.8 | –2.0 |
| Tropical wood | 114.7 | –2.9 | 0.6 | 8.4 |
| Sawn softwood | 88.5 | 1.3 | 11.9 | –10.5 |
| Minerals | 158.0 | –0.1 | –7.7 | –15.2 |
| Iron ore | 269.3 | –15.5 | –27.7 | –34.9 |
| Non-ferrous metals | 136.4 | 2.4 | –4.9 | –13.9 |
| Precious metals | 211.0 | –2.5 | –2.9 | –3.6 |
| All commodities | 160.1 | –1.0 | –3.2 | –6.4 |
- Source : INSEE
graphiqueG_petrole_ang – Oil (Brent)
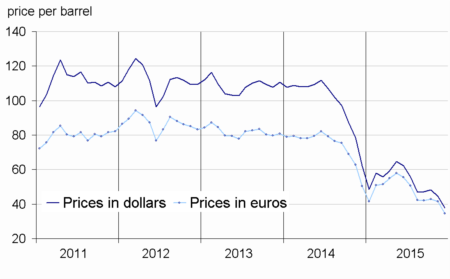
- Source : Insee
graphiqueG_alim_ang – Food
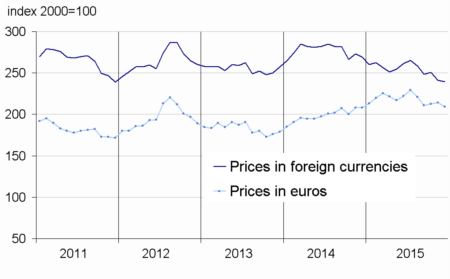
- Source : Insee
graphiqueG_ensemble_ang – Imported raw materials (excluding energy)
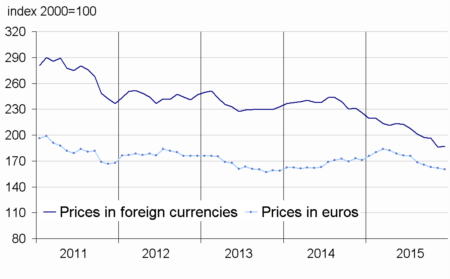
- Source : Insee
graphiqueG_indus_ang – Industrial raw materials
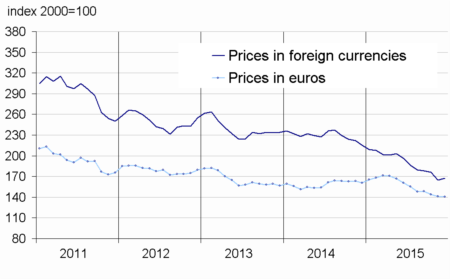
- Source : Insee
Pour en savoir plus
Time series : Raw materials prices
