


 24 March 2016
2016- n° 73In March 2016, the business climate in manufacturing has declined slightly Monthly business survey (goods-producing industries) - March 2016
24 March 2016
2016- n° 73In March 2016, the business climate in manufacturing has declined slightly Monthly business survey (goods-producing industries) - March 2016
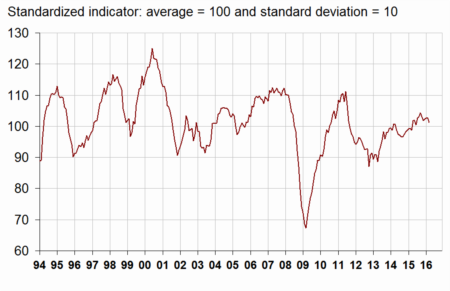
According to the business managers surveyed in March 2016, the business climate in industry has declined slightly. The composite indicator has decreased by 2 points but remains at a level (101) slightly above its long-term average (100).
According to the business managers surveyed in March 2016, the business climate in industry has declined slightly. The composite indicator has decreased by 2 points but remains at a level (101) slightly above its long-term average (100).
graphiqueGraphang1 – Business climate in industry - Composite indicator
The turning-point indicator has folded and is now in the zone indicating a short-term economic uncertainty.
graphiqueGraphang2 – Turning-point indicator
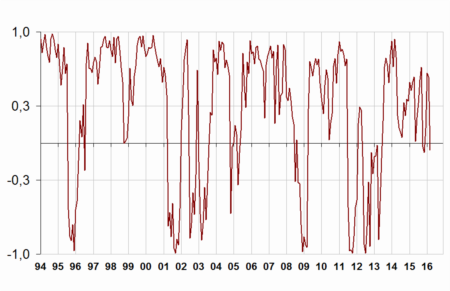
- Note: close to 1 (respectively –1), this indicator points to a favourable short-term economic situation (respectively unfavourable). Between –0.3 and +0.3: uncertainty area.
In March 2016, the balance of opinion on past activity, already below its long-term mean, has declined again (−16 points since November 2015). That on personal production prospects has fallen back (−4 points) but remains at a level (14) significantly above its long-term average (5).
However, industrialists are a little more optimistic than in February on general production prospects in the sector (+3 points). The corresponding balance is above its long-term average since February 2015.
In March, order books remain slightly above their long-term mean even if they have somewhat deteriorated abroad.
Finally, almost as many industrialists as in February consider that finished-goods inventories are below normal: the corresponding balance has risen by 1 point but is still inferior to its long-term average.
tableautableau1 – Industrialists' opinion on manufacturing activity
| Manufacturing industry | Ave.* | Dec. 15 | Jan. 16 | Feb. 16 | March 16 |
|---|---|---|---|---|---|
| Composite indicator | 100 | 102 | 103 | 103 | 101 |
| Past activity | 4 | 1 | –1 | –3 | –6 |
| Finished-goods inventory | 13 | 12 | 6 | 4 | 5 |
| Global order books | –18 | –11 | –11 | –14 | –15 |
| Export order books | –14 | –10 | –11 | –11 | –13 |
| Personal production expectations | 5 | 9 | 11 | 18 | 14 |
| General production expectations | –9 | 0 | 2 | –4 | –1 |
- * Long-term average since 1976.
- Source: Monthly business survey - INSEE
Sector-based analysis
MAN. OF FOOD PRODUCTS AND BEVERAGES
In the manufacture of food products and beverages, the balance on past activity has fallen and has become lower than normal. Conversely, that on production prospects has recovered and has returned to above its mean. Order books have improved, the corresponding balances are superior to their average level. Finished-goods inventories are judged even higher, the corresponding balance already being above its mean in February.
MACHINENERY AND EQUIPMENT GOODS
In the manufacture of machinery and equipment goods, the balance on past activity has recovered slightly but remains below its long-term average. That on production prospects has declined, slipping back to virtually its normal level. The balance on inventories of finished products has increased a little, moving up closer to its mean level. Global and export order books have deteriorated; the latter balance has become inferior to the normal.
MAN. OF TRANSPORT EQUIPMENT
Man. of motor vehicles, trailers and semi trailers
In the manufacture of motor vehicles, trailers and semi trailers, the balance on past activity has gone up sharply again and stands significantly above its average. That on production prospects has fallen to close to its January's level, significantly above the normal. Global and export order books have deteriorated dramatically albeit remaining above their mean. The balance on inventories of finished goods is stable below its long-term average.
Man. of other transport equipment
In the manufacture of other transport equipment, the balances on past activity and on production prospects have edged up; the first one remains below its long-term average while the second one is still significantly above normal. The level of inventories of finished products is still considered above its long-term average. Global order books have deteriorated further albeit remaining above their long-term average.
OTHER MANUFACTURING
In “other manufacturing”, the balances of opinion on past activity and on production prospects have weakened in March. They are below their long-term average. On a sub-sector level, the balance on past activity has fell back in chemicals and in plastics products, has increased slightly in basic metals and has picked up in pharmaceuticals. That on expected activity has tumbled in the manufacture of basic metals while it has advanced in pharmaceuticals and in plastic product manufacture. It is flat significantly below normal in chemicals. In “other manufacturing”, global order books are virtually stable and have filled up a little abroad. They continued to improve in plastics sector, the corresponding balances exceeding slightly their long-term average. In chemicals, pharmaceuticals and in basic metals, order books are virtually stable overall although they have improved abroad. Finally, inventories of finished goods are considered lower overall, due to pharmaceuticals, while they are judged higher in chemicals and plastics industries.
tableautableau2 – Industrialists' opinion in a sector-based approach
| NA* : (A17) et [A 38 et A 64] | Aver.** | Jan. 16 | Feb. 16 | March 16 |
|---|---|---|---|---|
| (C1) Man. of goods products and beverages | ||||
| Past activity | 6 | 10 | 7 | –3 |
| Finished-goods inventory | 12 | 9 | 14 | 16 |
| Global order books | –18 | –11 | –19 | –16 |
| Export order books | –13 | –13 | –12 | –8 |
| Personal production expectations | 7 | 14 | 6 | 10 |
| (C3) Machinery and equipment goods | ||||
| Past activity | 4 | 5 | –6 | –4 |
| Finished-goods inventory | 17 | 20 | 13 | 16 |
| Global order books | –24 | –19 | –16 | –19 |
| Export order books | –22 | –22 | –20 | –25 |
| Personal production expectations | 2 | 5 | 11 | 3 |
| (C4) Man. of transport equipment | ||||
| Past activity | 8 | 13 | 16 | 27 |
| Finished-goods inventory | 14 | 10 | 21 | 23 |
| Global order books | –13 | 13 | 18 | 2 |
| Export order books | –12 | –1 | 0 | –17 |
| Personal production expectations | 9 | 36 | 54 | 38 |
| Man. of motor vehicules, trailers and semi-trailers [CL1] | ||||
| Past activity | 4 | 14 | 29 | 45 |
| Finished-goods inventory | 10 | 12 | 0 | 1 |
| Global order books | –19 | 4 | 20 | –7 |
| Export order books | –13 | 3 | 22 | –6 |
| Personal production expectations | 4 | 49 | 68 | 45 |
| Man. of other transport equipment [CL2] | ||||
| Past activity | 15 | 17 | 6 | 9 |
| Finished-goods inventory | 21 | 9 | 43 | 46 |
| Global order books | –4 | 23 | 17 | 12 |
| Export order books | –10 | –5 | –17 | –25 |
| Personal production expectations | 15 | 27 | 37 | 39 |
| (C5) Other manufacturing | ||||
| Past activity | 1 | 3 | 0 | –4 |
| Finished-goods inventory | 10 | 7 | 7 | 4 |
| Global order books | –20 | –22 | –23 | –22 |
| Export order books | –13 | –11 | –12 | –9 |
| Personal production expectations | 4 | 0 | 6 | 3 |
| Man. of chemicals and chemical products [CE] | ||||
| Past activity | 6 | 9 | 17 | 11 |
| Finished-goods inventory | 6 | 6 | 9 | 12 |
| Global order books | –13 | –18 | –19 | –18 |
| Export order books | –8 | –8 | –7 | –3 |
| Personal production expectations | 13 | 6 | –3 | –4 |
| Man. of basic pharmaceutical products [CF] | ||||
| Past activity | 16 | –30 | –57 | –29 |
| Finished-goods inventory | 9 | 6 | 4 | –38 |
| Global order books | 3 | –2 | –2 | –2 |
| Export order books | 10 | –1 | –1 | 2 |
| Personal production expectations | 15 | –14 | 35 | 51 |
| Man. of rubber and plastic products [CG] | ||||
| Past activity | –3 | 5 | 10 | –1 |
| Finished-goods inventory | 11 | 13 | 5 | 9 |
| Global order books | –26 | –35 | –31 | –24 |
| Export order books | –18 | –22 | –15 | –12 |
| Personal production expectations | –1 | 0 | 1 | 8 |
| Man. of basic metals and fabricated metal products [CH] | ||||
| Past activity | 0 | –16 | –4 | –1 |
| Finished-goods inventory | 7 | 3 | 7 | 6 |
| Global order books | –20 | –30 | –23 | –22 |
| Export order books | –16 | –18 | –25 | –18 |
| Personal production expectations | 1 | 5 | 10 | –8 |
- * NA: aggregated classification, based on the NAF rév.2.
- ** Long-term average since 1976.
Documentation
Methodology (pdf,133 Ko)
Pour en savoir plus
Time series : Industry - Activity and demand
