


 10 February 2016
2016- n° 34In December 2015, manufacturing output decreased (−0.8%) Industrial production index - December 2015
10 February 2016
2016- n° 34In December 2015, manufacturing output decreased (−0.8%) Industrial production index - December 2015
In December 2015, output fell back in the manufacturing industry (-0.8% after +0.6% in November). It continued to decline in the industry as a whole (-1.6% after -0,9% in November).

Warnings: Please note: all the series are seasonally (SA) and working-day adjusted (WDA).
The models used to calculate the SA and WDA series, as well as the weights, will be updated for the publication of the industrial production indices of January 2016 on March 10th, 2016.
In December 2015, output fell back in the manufacturing industry (−0.8% after +0.6% in November). It continued to decline in the industry as a whole (−1.6% after −0,9% in November).
Manufacturing output rose over G4 2015 (+0.4%)
Manufacturing output rose over the fourth quarter of 2015 compared to the third quarter (+0.4% q-o-q). Output increased more slightly in the whole industry (+0.2%).
Output increased in other manufacturing (+0.9%), and surged in the manufacture of coke and refined petroleum products (+6.8%). On the contrary, output decreased in mining and quarrying; energy; water supply; waste management (−0.6%), in the manufacture of food products and beverages (−0.9%), in the manufacture of transport equipment (−0.7%) and in the manufacture of electrical and electronic equipment; machine equipment (−0.6%).
Over the year, manufacturing output increased sharply (+1.7%)
Manufacturing output of the last quarter of 2015 improved sharply compared to the last quarter of 2014 (+1.7% y-o-y). For that same period, overall industrial output grew even more (+2.0% y-o-y).
Over the year, output rose in all sectors. It expanded markedly in other manufacturing (+1.8%), in mining and quarrying; energy; water supply; waste management (+3.3%) and in the manufacture of transport equipment (+3.2%). It went up more moderately in the manufacture of electrical and electronic equipment (+0.7%) and in the manufacture of food products and beverages (+0.9%). It rose sharply in the manufacture of coke and refined petroleum products (+2.7%).
graphiqueGraphique1a – Monthly Industrial Production Indices
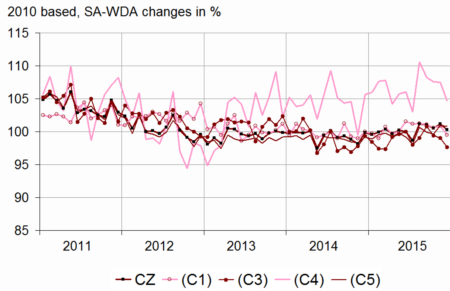
- Legend: CZ: Manufacturing - (C1): Manufacture of food products and beverages - (C3): Electrical and electronic equipment; machine equipment - (C4): Manufacture of transport equipment - (C5): Other manufacturing
- Sources: INSEE, SSP, SOeS
tableauTableau1a – Variation of the Industrial Production
| NA: A10, (A17) | Dec. / Nov. | Nov. / Oct. | Q-o-Q change (1) | Year on year change (2) |
|---|---|---|---|---|
| BE: INDUSTRY | –1.6 | –0.9 | 0.2 | 2.0 |
| CZ: Manufacturing | –0.8 | 0.6 | 0.4 | 1.7 |
| (C1): Manufacture of food products and beverages | –1.4 | 0.3 | –0.9 | 0.9 |
| (C2): Manufacture of coke and refined petroleum products | –2.6 | –9.0 | 6.8 | 2.7 |
| (C3): Electrical and electronic equipment; machine equipment | –1.4 | –0.4 | –0.6 | 0.7 |
| (C4): Manufacture of transport equipment | –2.6 | –0.1 | –0.7 | 3.2 |
| (C5): Other manufacturing | –0.1 | 1.4 | 0.9 | 1.8 |
| DE: Mining and quarrying; energy; water supply; waste management | –5.2 | –7.4 | –0.6 | 3.3 |
| FZ: CONSTRUCTION | –1.6 | 1.2 | 0.0 | –1.8 |
- (1) Last three months / previous three months
- (2) Last three months / same three months of previous year
- The codes correspond to the level of aggregation A 10 (A 17) of the "NA" aggregated classification based on the French classification of activities NAF rev.2.
- Sources: INSEE, SSP, SOeS
tableauTableau2a – Variation of the Industrial Production
| NA: A10, (A17), [A38 ou A64] | Dec. 2015 | Dec. / Nov. | Nov. / Oct. | Quarter on quarter change |
|---|---|---|---|---|
| BE: INDUSTRY | 98.5 | –1.6 | –0.9 | 0.2 |
| CZ: Manufacturing | 100.3 | –0.8 | 0.6 | 0.4 |
| (C1): Man. of food products and beverages | 99.5 | –1.4 | 0.3 | –0.9 |
| (C2): Man. of coke and refined petroleum products | 85.0 | –2.6 | –9.0 | 6.8 |
| (C3): Electrical and electronic equipment; machine equipment | 97.7 | –1.4 | –0.4 | –0.6 |
| [CI] Man. of computer. electronic and optical products | 107.0 | –5.1 | 1.5 | 0.0 |
| [CJ] Man. of electrical equipment | 85.1 | –2.0 | –0.7 | –2.5 |
| [CK] Man. of machinery and equipment n.e.c. (1) | 99.8 | 1.5 | –1.5 | 0.1 |
| (C4): Man. of transport equipment | 104.7 | –2.6 | –0.1 | –0.7 |
| [CL1] Man. of motor vehicles. trailers and semi-trailers | 95.3 | –3.7 | 1.7 | 0.8 |
| [CL2] Man. of other transport equipment | 115.3 | –1.6 | –1.7 | –2.0 |
| (C5): Other manufacturing | 100.8 | –0.1 | 1.4 | 0.9 |
| [CB] Man. of textiles, wearing apparel, leather and related products | 99.4 | –4.7 | 7.1 | 3.1 |
| [CC] Man. of wood and paper products; printing and reproduction of recorded media | 87.4 | –1.3 | 1.6 | –0.4 |
| [CE] Man. of chemicals and chemical products | 112.0 | 0.2 | 2.5 | –0.1 |
| [CF] Man. of basic pharmaceutical products and pharmaceutical preparations | 115.4 | 0.8 | 1.1 | 3.1 |
| [CG] Man. of rubber and plastics products, and other non-metallic mineral products | 97.8 | –0.9 | 1.0 | 1.3 |
| [CH] Man. of basic metals and fabricated metal products, except machinery and equipment | 97.9 | 0.2 | 0.5 | 1.5 |
| [CM] Other manufacturing; repair and installation of machinery and equipment | 102.3 | 0.6 | 1.2 | –0.5 |
| DE: Mining and quarrying; energy; water supply; waste management | 90.6 | –5.2 | –7.4 | –0.6 |
| [BZ] Mining and quarrying | 94.3 | –2.7 | 2.1 | 0.9 |
| [DZ] Electricity, gas, steam and air-conditioning supply | 86.5 | –6.4 | –9.0 | –1.0 |
| [EZ] Water supply; sewerage, waste management and remediation | 117.9 | 0.6 | –2.0 | 0.7 |
| FZ: CONSTRUCTION | 86.0 | –1.6 | 1.2 | 0.0 |
| MIGs (2) | ||||
| Capital goods | 101.1 | –0.9 | 0.3 | –0.3 |
| Intermediate goods | 98.2 | –0.2 | 1.0 | 0.7 |
| Consumer durables | 102.2 | –1.5 | –1.2 | 0.6 |
| Consumer non-durables | 103.8 | –1.6 | 1.6 | 0.3 |
| Energy | 89.8 | –5.1 | –8.0 | –0.2 |
- (1) n.e.c.: not elsewhere classifiable
- (2) Main industrial groupings: definition in Commission regulation EC of June 14th 2007
- Sources: INSEE, SSP, SOeS
In December 2015, output tumbled again in mining and quarrying; energy; water supply; waste management (−5.2% after −7.4% in November)
Output dropped sharply once again in electricity, gas, steam and air-conditioning supply (−6.4% after −9.0%), because of exceptionnaly mild temperatures in December.
Output slid in the manufacture of transport equipment (−2.6% after −0.1%)
Output slipped back sharply in the manufacture of motor vehicles, trailers and semi-trailers (−3.7% after +1.7% in November) and declined again in the manufacture of other transport equipment (−1.6% after −1.7%).
Output decreased in the electrical and electronic equipment; machine equipment (−1.4% after −0.4%)
Output shrank in the manufacture of computer, electronic and optical products (−5.1% after +1.5%) and in the manufacture of electrical equipment (−2.0%). On the contrary, it strengthened in the manufacture of machinery and equipment (+1.5%).
Output fell back in the manufacture of food products and beverages (−1.4% after +0,3%)
Output faltered in the manufacture of food products and beverages (−1.4%), such as dairy products.
Output was almost unchanged in other manufacturing (−0.1% after +1.4%)
Output fell back steeply in the manufacture of textiles, wearing apparel, leather and related products (−4.7%). It also weakened, albeit more moderately in the manufacture of rubber and plastics products, and other non-metallic mineral products (−0.9%) and in the manufacture of wood and paper products, printing and reproduction of recorded media (−1.3%), Conversely, it grew in other manufacturing repair and installation of machinery and equipment (+0.6%), in pharmaceuticals (+0.8%) and in metallurgy (+0.2%).
Output fell again in the manufacture of coke and refined petroleum products (−2.6% after −9.0%).
Output continued to decline in the manufacture of coke and refined petroleum products, due to the partial closure of a refinery.
Revisions in November 2015
tableauTableau3a – Measure of variations' revisions
| Nov. / Oct. | Oct. / Sept. | Sept. / Aug. | Q3 2015 / Q2 2015 | 2014 / 2013 | |
|---|---|---|---|---|---|
| Industry (BE) | 0.01 | –0.04 | –0.04 | –0.06 | –0.01 |
| raw serie | 0.23 | –0.06 | –0.01 | –0.01 | 0.00 |
| SA-WDA coefficient | –0.22 | 0.02 | –0.03 | –0.05 | –0.01 |
| Manufacturing (CZ) | 0.19 | –0.10 | –0.04 | –0.04 | –0.01 |
| raw serie | 0.30 | –0.06 | –0.02 | –0.01 | 0.01 |
| SA-WDA coefficient | –0.11 | –0.04 | –0.02 | –0.03 | –0.02 |
- How to read it: in the manufacturing sector, the SA-WDA variation between October 2015 and November 2015 is revised by +0.19 points, +0.30 is due to the revision of the raw series and −0.11 to the new calculation of the SA-WDA.
- Sources: INSEE, SSP, SOeS
Documentation
Methodology (pdf,163 Ko)
Pour en savoir plus
