


 13 April 2016
2016- n° 97In March 2016, prices of frequently purchased goods decreased slightly again in hyper
and supermarkets Price Index in large and predominantly-food stores - March 2016
13 April 2016
2016- n° 97In March 2016, prices of frequently purchased goods decreased slightly again in hyper
and supermarkets Price Index in large and predominantly-food stores - March 2016
In March 2016, prices of frequently purchased goods faltered slightly once again in hyper and supermarkets as well as in large and predominantly food stores (-0.1% for both kinds of stores, as in February).
In March 2016, prices of frequently purchased goods faltered slightly once again in hyper and supermarkets as well as in large and predominantly food stores (−0.1% for both kinds of stores, as in February).
By contrast, excluding hyper and supermarkets, prices of frequently purchased goods continued to edge up (+0.1% after +0.2% in February).
Considering all the kinds of stores, prices of frequently purchased goods declined by 0.1% over one month.
Year-on-year, prices still decreased in hyper and supermarkets
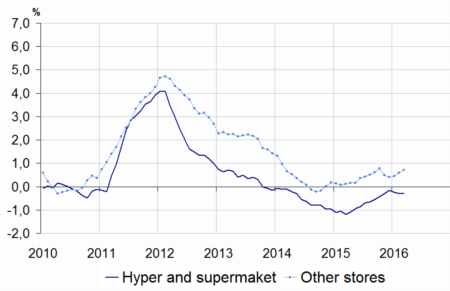
Year-on-year, prices of frequently purchased goods in hyper and supermarkets dropped by 0.3% in March, as in the previous month. In large and predominantly food stores, they also fell by 0.3% year-on-year.
Conversely, prices of frequently purchased goods accelerated slightly again in the other kinds of stores (+0.7% year-on-year in March after +0.6% in February and +0.4% in January).
Considering all stores, prices of frequently purchased goods were overall stable year-on-year in March as in the two previous months.
graphiqueGraphique1English – Frequently purchased goods price indexes year-on-year change %
- Geographical coverage: metropolitan France
- Source: INSEE - Consumer Price Indexes
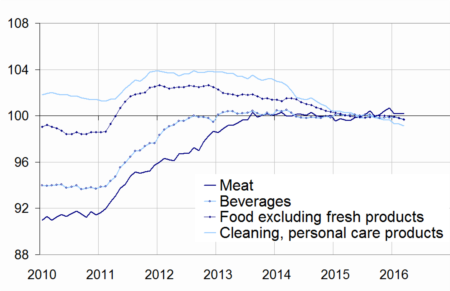
graphiqueGraphique2English – Frequently purchased goods price indexes
- Geographical coverage: metropolitan France
- Source: INSEE - Consumer Price Indexes
tableauTableau1English – Prices of frequently purchased goods
| Index | Changes (%) compared to | ||
|---|---|---|---|
| March 2016 | last month (m-o-m) | 12 months before (y-o-y) | |
| Hyper and supermarkets (A) | 99.70 | −0.1 | −0.3 |
| Large and predominantly food stores (A + neighborhood stores) | 99.72 | −0.1 | −0.3 |
| Other stores | 100.48 | 0.1 | 0.7 |
| All stores | 99.91 | −0.1 | 0.0 |
- Geographical coverage: metropolitan France
- Source: INSEE - Consumer Price Indexes
tableauTableau2English – Prices of frequently purchased goods detailed by main items
| Index | Changes (%) compared to | ||
|---|---|---|---|
| March 2016 | last month (m-o-m) | 12 months before (y-o-y) | |
| Food and beverages (excluding fresh foodstuffs) | 99.81 | −0.1 | −0.1 |
| - Meat | 100.20 | 0.0 | 0.6 |
| - Beverages | 99.67 | −0.1 | −0.3 |
| - Other food products | 99.65 | −0.2 | −0.4 |
| Clearing and personal care products | 99.13 | −0.2 | −1.1 |
| Total Hyper-and-Supermarkets | 99.70 | −0.1 | −0.3 |
- Geographical coverage: metropolitan France
- Source: INSEE - Consumer Price Indexes
Further moderate decline in food prices in hyper and supermarkets
In March 2016, prices of food excluding fresh foodstuffs sold in hyper and supermarkets slipped by 0.1% for the third month in a row. Year-on-year, they were down by 0.1%, as in February.
Prices of meat were overall stable, as in February. Year-on-year, they increased by 0.6%, slightly more than in February (+0.4%). In March 2015, they had diminished by 0.4% year-on-year.
Beverage prices fell down slightly (−0.1%) over one month, as in February. In March, this decline affected both alcoholic beverages and non-alcoholic ones. Year-on-year, prices of beverages sold in supermarkets were down slightly (−0.3% as in February).
Prices of other food products (excluding fresh food) edged down in March (−0.2%), after a drop by 0.1% in February. Year-on-year, they slipped by 0.4% for the fifth month in a row. In March 2015, they had fallen by 1.4% year-on-year.
Downturn in prices of cleaning and personal care products in hyper and supermarkets
In March, prices of cleaning and personal care products sold in hyper and supermarkets faltered by 0.2% after a stability in February. Year-on-year, they decreased by 1.1% as in the two previous month. In March 2015, their fall had been even more pronounced year-on-year (−2.3%).
Pour en savoir plus
