


 19 April 2016
2016- n° 100In March 2016, oil prices picked up significantly Prices of oil and raw material imports - March 2016
19 April 2016
2016- n° 100In March 2016, oil prices picked up significantly Prices of oil and raw material imports - March 2016
In March 2016, the crude oil price in euros picked up significantly (+17.3% after +5.4% in Februrary). This recovery did not offset previous falls: standing at €35.1 on average per barrel of Brent, this price was 31.9% lower than one year ago.
In March 2016, the crude oil price in euros picked up significantly (+17.3% after +5.4% in Februrary). This recovery did not offset previous falls: standing at €35.1 on average per barrel of Brent, this price was 31.9% lower than one year ago.
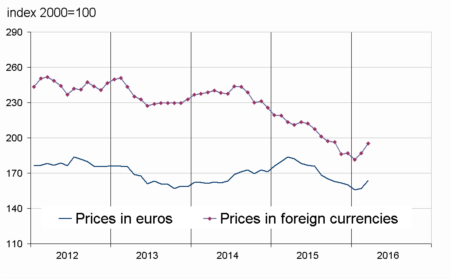
Prices in euros of the other imported commodities kept rallying (+4.2% after +0.8%). The industrial raw material price increase is more pronounced (+2.8%) than the one of raw food materials (1.9%).
Oil prices increased steeply
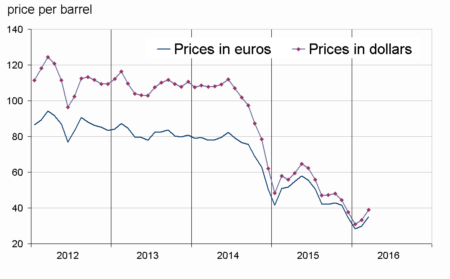
In March, the price of crude oil from the North Sea (Brent) in euros kept climbing (+17,3%), more vigourously than in February (+5.4%). This recovery did not offset the decline during previous months (−31.9% over one year). This increase is likely explained by the prospects of a production freezing agreement between several producting countries, among which Saudi Arabia and Russia, in spite of Iran's will to ramp its supply up. In dollars, the price rise was a little more marked (+17.7% after +7.8%) since the euro appreciated slightly.
graphiqueG_petrole_ang – Oil (Brent)
- Source : INSEE
tableautabpetrole – Oil and petroleum products
| Prices | Change (%) | |||
|---|---|---|---|---|
| of last month | over the last month | over the last 3 months | over the last 12 months | |
| Brent in $ per barrel | 39.1 | 17.7 | 3.6 | –30.0 |
| Brent in € per barrel | 35.1 | 17.3 | 1.3 | –31.9 |
| Gasoline €/L | 0.29 | 27.3 | –0.1 | –30.3 |
| Gas Oil | 319.3 | 15.9 | –1.5 | –36.6 |
| Heavy fuel | 163.1 | 5.8 | 1.5 | –43.6 |
| Naphtha | 309.3 | 18.1 | –13.7 | –34.0 |
- Prices are in euros per tonne unless otherwise specified
- Source : INSEE
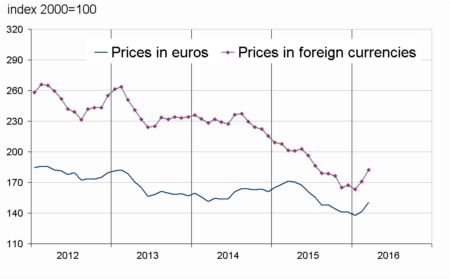
Prices of industrial raw materials kept rallying
Prices of industrial raw materials in euros accelerated (+6.2% after +2.8%). On the one hand, mineral prices went up (+6.6% after +4.2%). This new increase was mainly due to skyrocketing iron ore prices (+19.8% after +9.5%; +37.1% over the last three months). The announcement of a partial merger project between two of the top five producers may account for this buoyancy. On the other hand, prices of agricultural raw materials bounced back (+6,0% after −2.1%). In fact, the price of natural rubber increased significantly (+19.9% after +2.1%) similarly to the price of sawn softwood (+15.7% after −4.9%). The soaring of natural rubber price may result from a seasonal production decrease, and from the price increase of oil from which synthetic rubber is derived. The rise of these two prices did more than offset the slight decrease of other agricultral raw material prices.
graphiqueG_indus_ang – Industrial raw materials
- Source : INSEE
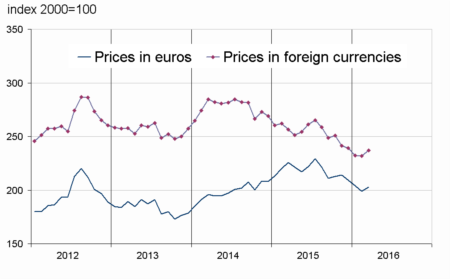
Prices of raw food materials bounced back
In March, prices of raw food materials in euros bounced back (+1.9%) after a four-month drop. The rebound of sugar price is notably strong (+15.5% after −8.9% and −4.4%), as a result of poor supply prospects in Brasil due to abundant rainfalls. Prices of tropical foodstuffs increased also (+4,0% after −4.3%). Price of oils seeds and vegetable oils varied a little (+0.4% after −0.3%), similarly to those of cereals (−0.6% after +0.2%). The price of beef meat went up slightly (+1.2% after −4.1%).
graphiqueG_alim_ang – Food
- Source : INSEE
graphiqueG_ensemble_ang – Imported raw materials (excluding energy)
- Source : INSEE
tableautabmatprem – Imported raw materials (excluding energy) in euros
| Index | Changes (%) | |||
|---|---|---|---|---|
| of last month | over the last month | over the last 3 months | over the last 12 months | |
| Food total | 202.9 | 1.9 | –3.1 | –10.1 |
| Tropical foodstuffs | 203.0 | 4.0 | –9.9 | –3.3 |
| Oil seeds, vegetable oils | 210.5 | 0.4 | –1.3 | –14.7 |
| Cereals | 148.2 | –0.6 | –0.5 | –9.2 |
| Sugar | 155.3 | 15.5 | 0.6 | 16.8 |
| Beef meat | 164.4 | 1.2 | 3.1 | –15.5 |
| Industrial raw materials | 150.3 | 6.2 | 6.7 | –12.2 |
| Agricultural raw materials | 110.2 | 6.0 | 0.9 | –8.8 |
| Natural Fibres | 114.3 | –1.5 | –7.5 | –6.3 |
| Natural rubber | 134.6 | 19.9 | 13.6 | –19.9 |
| Hides | 75.4 | 2.9 | –0.1 | –31.4 |
| Wood pulp | 96.2 | –0.7 | –4.4 | –13.3 |
| Tropical wood | 106.5 | –1.0 | –7.2 | –7.8 |
| Sawn softwood | 94.6 | 15.7 | 6.9 | 0.0 |
| Minerals | 172.2 | 6.6 | 9.0 | –13.4 |
| Iron ore | 369.3 | 19.8 | 37.1 | –5.2 |
| Non-ferrous metals | 142.3 | 4.7 | 4.3 | –15.7 |
| Precious metals | 230.0 | 3.3 | 9.0 | –8.2 |
| All commodities | 163.7 | 4.2 | 2.3 | –11.0 |
- Source : INSEE
Pour en savoir plus
Time series : Raw materials prices
