


 23 February 2016
2016- n° 43In February 2016, the business climate in manufacturing holds steady, above its long-term
average Monthly business survey (goods-producing industries) - February 2016
23 February 2016
2016- n° 43In February 2016, the business climate in manufacturing holds steady, above its long-term
average Monthly business survey (goods-producing industries) - February 2016
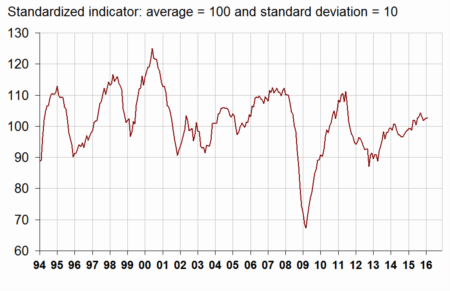
According to the business managers surveyed in February 2016, the business climate in industry holds steady. The composite indicator remains at a level (103) above its long-term average (100).
According to the business managers surveyed in February 2016, the business climate in industry holds steady. The composite indicator remains at a level (103) above its long-term average (100).
graphiqueGraphang1 – Business climate in industry - Composite indicator
The turning-point indicator is still in the zone indicating a favourable economic outlook.
graphiqueGraphang2 – Turning-point indicator
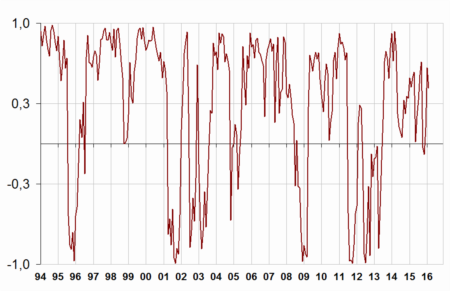
- Note: close to 1 (respectively –1), this indicator points to a favourable short-term economic situation (respectively unfavourable).
In February 2016, the balance of opinion on past activity, already below its long-term mean, has declined again (−13 points since November 2015). Conversely, that on personal production expectations is still increasing (+15 points since November 2015) and has hit its highest level since April 2011, significantly above its long-term average.
However, industrialists are less optimistic than in January on general production expectations of the sector (–6 points). Nevertheless, this balance remains above its long-term average.
In February, while order books have somewhat deteriorated on the whole, they have held roughly steady abroad; the corresponding balances of opinion are above their long-term mean.
Finally, almost as many industrialists as in January consider that stocks of finished products are above normal, the corresponding balance has risen by 1 point and is still inferior to its long-term average.
tableautableau1 – Industrialists' opinion on manufacturing activity
| Manufacturing industry | Ave.* | Nov. 15 | Dec. 15 | Jan. 16 | Feb. 16 |
|---|---|---|---|---|---|
| Composite indicator | 100 | 102 | 102 | 103 | 103 |
| Past activity | 4 | 10 | 1 | –1 | –3 |
| Finished-goods inventory | 13 | 11 | 12 | 6 | 7 |
| Global order books | –18 | –17 | –11 | –11 | –14 |
| Export order books | –14 | –14 | –10 | –11 | –10 |
| Personal production expectations | 5 | 2 | 9 | 11 | 17 |
| General production expectations | –9 | 9 | 0 | 2 | –4 |
- * Long-term average since 1976.
- Source: Monthly business survey - INSEE
Sector-based analysis
MAN. OF FOOD PRODUCTS AND BEVERAGES
In the manufacture of food products and beverages, the balances on past activity and on production prospects have fallen back. The first one has reached its long-term average and the second one has become lower than normal. While global order books have deteriorated, export order books are stable; the corresponding balances stand at their average level. Stocks of finished products are judged higher and the corresponding balance is close to its mean.
MACHINENERY AND EQUIPMENT GOODS
In the manufacture of machinery and equipment goods, the balance on past activity has declined, dropping back below its long-term average. That on production prospects, already above normal in January, has increased again. The balance on stocks of finished products has slipped back and has become inferior to its mean level. Global and export order books have improved again and are above the normal.
MAN. OF TRANSPORT EQUIPMENT
Man. of motor vehicles, trailers and semi trailers
In the manufacture of motor vehicles, trailers and semi trailers, the balances on past activity and on production prospects, already above their long-term average in January, have gone up sharply again. Global order books have filled up and are significantly above normal. Stocks of finished goods are considered lower, the corresponding balance has fell back to its December's level, below its long-term average.
Man. of other transport equipment
In the manufacture of other transport equipment, the balance on past activity has declined and has returned below its long-term average. Conversely, that on production prospects, already above normal, has improved again. Stocks of finished products are considered much more higher, the corresponding balance has returned above its long-term level. Global order books have deteriorated slightly but remain above their long-term average.
OTHER MANUFACTURING
In “other manufacturing”, while the balance of opinion on production prospects has bounced back, that on past activity has decreased again. Both are close to their long-term average. On a sub-sector level, the balance on past activity has improved in chemicals, basic metals and plastics products but has continued to slump in pharmaceuticals. That on expected activity has gone up sharply in the manufacture of pharmaceuticals, has risen slightly in that of basic metals, is virtually stable in that of plastic products and has continued to decline in that of chemicals. Order books are virtually stable in the manufacture of chemicals and in that of pharmaceuticals and have increased slightly in that of plastic products. In basic metals, they have improved on the whole but are virtually stable abroad. Finally, stocks of finished goods are considered higher in the manufacture of chemicals and in that of basic metals and lower in that of pharmaceuticals and in that of plastic products.
Revisions
The business climate has been raised by one point in January 2016, at 103. This slight revision comes from late answers from businesses that have been taken into account.
tableautableau2 – Industrialists' opinion in a sector-based approach
| NA* : (A17) et [A 38 et A 64] | Aver.** | Dec. 15 | Jan. 16 | Feb. 16 |
|---|---|---|---|---|
| (C1) Man. of goods products and beverages | ||||
| Past activity | 6 | 1 | 10 | 6 |
| Finished-goods inventory | 12 | 18 | 9 | 11 |
| Global order books | –18 | –12 | –11 | –18 |
| Export order books | –13 | –9 | –13 | –13 |
| Personal production expectations | 7 | 5 | 14 | 3 |
| (C3) Machinery and equipment goods | ||||
| Past activity | 4 | –1 | 5 | –2 |
| Finished-goods inventory | 17 | 19 | 20 | 14 |
| Global order books | –24 | –26 | –19 | –18 |
| Export order books | –22 | –27 | –22 | –18 |
| Personal production expectations | 2 | –5 | 5 | 10 |
| (C4) Man. of transport equipment | ||||
| Past activity | 8 | 35 | 13 | 18 |
| Finished-goods inventory | 14 | 23 | 10 | 19 |
| Global order books | –13 | 15 | 13 | 20 |
| Export order books | –12 | –1 | –1 | –1 |
| Personal production expectations | 9 | 15 | 36 | 53 |
| Man. of motor vehicules, trailers and semi-trailers [CL1] | ||||
| Past activity | 4 | 46 | 14 | 30 |
| Finished-goods inventory | 10 | –1 | 12 | –1 |
| Global order books | –20 | 9 | 4 | 20 |
| Export order books | –13 | 10 | 3 | 20 |
| Personal production expectations | 4 | –9 | 49 | 66 |
| Man. of other transport equipment [CL2] | ||||
| Past activity | 15 | 22 | 17 | 10 |
| Finished-goods inventory | 21 | 48 | 9 | 40 |
| Global order books | –4 | 20 | 23 | 19 |
| Export order books | –10 | –9 | –5 | –17 |
| Personal production expectations | 15 | 30 | 27 | 35 |
| (C5) Other manufacturing | ||||
| Past activity | 1 | 5 | 3 | 0 |
| Finished-goods inventory | 10 | 7 | 7 | 7 |
| Global order books | –20 | –20 | –22 | –23 |
| Export order books | –13 | –8 | –11 | –12 |
| Personal production expectations | 4 | 5 | 0 | 5 |
| Man. of chemicals and chemical products [CE] | ||||
| Past activity | 6 | 18 | 9 | 15 |
| Finished-goods inventory | 6 | –3 | 6 | 9 |
| Global order books | –13 | –10 | –18 | –19 |
| Export order books | –8 | –3 | –8 | –8 |
| Personal production expectations | 13 | 10 | 6 | –2 |
| Man. of basic pharmaceutical products [CF] | ||||
| Past activity | 16 | 25 | –30 | –57 |
| Finished-goods inventory | 9 | 6 | 6 | 3 |
| Global order books | 3 | –2 | –2 | –2 |
| Export order books | 10 | 3 | –1 | –1 |
| Personal production expectations | 14 | –35 | –14 | 35 |
| Man. of rubber and plastic products [CG] | ||||
| Past activity | –3 | 6 | 5 | 9 |
| Finished-goods inventory | 11 | 12 | 13 | 4 |
| Global order books | –26 | –40 | –35 | –32 |
| Export order books | –18 | –13 | –22 | –14 |
| Personal production expectations | –1 | –6 | 0 | –1 |
| Man. of basic metals and fabricated metal products [CH] | ||||
| Past activity | –1 | 0 | –16 | –7 |
| Finished-goods inventory | 7 | 13 | 3 | 9 |
| Global order books | –20 | –23 | –30 | –24 |
| Export order books | –15 | –18 | –18 | –19 |
| Personal production expectations | 1 | 13 | 5 | 9 |
- * NA: aggregated classification, based on the NAF rév.2.
- ** Long-term average since 1976.
- Source: INSEE - Monthly business survey
Documentation
Methodology (pdf,133 Ko)
Pour en savoir plus
Time series : Industry - Activity and demand
