


 28 September 2012
2012- n° 240Prices for food and petroleum products rose in both July and August Industrial Producer and Import Price Indices - July-August 2012
28 September 2012
2012- n° 240Prices for food and petroleum products rose in both July and August Industrial Producer and Import Price Indices - July-August 2012
In August, French producer prices in industry increased significantly (+1.2 %), following a more moderate rise in July (+0.4 %). Prices for refined petroleum products and food products rose in both months, while prices for "other manufactured products" rose back in August (+0.4 %) after having significantly dropped in July (–0.6 %)
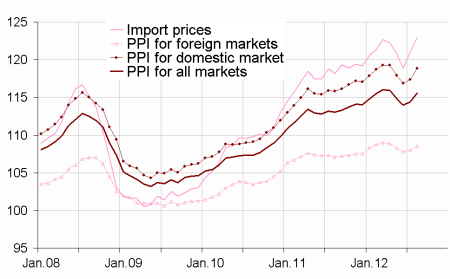
- Producer price indices in French industry
- FRENCH MARKET: +1.2 % in August, following +0.4 % in July
- FOREIGN MARKETS: +0,5 % in August, following +0.2 % in July
- ALL MARKETS: +1.0 % in August following +0.4 % in July
- Import prices indices of industrial products : +1.6 % in August following +1.8 % in July
Producer price indices in French industry
FRENCH MARKET: +1.2 % in August, following +0.4 % in July
In August, French producer prices in industry increased significantly (+1.2 %), following a more moderate rise in July (+0.4 %). Prices for refined petroleum products and food products rose in both months, while prices for "other manufactured products" rose back in August (+0.4 %) after having significantly dropped in July (–0.6 %)
Prices for refined petroleum products increased in both August and July ...
Prices for refined petroleum products moved up in both August (+7.8 %) and July (+5.8 %). Indeed, the price for Brent crude sourced from the North Sea continued to rise in dollar terms (+9.9 % following +6.6 %), as well as in euro terms (+8.8 % following +8.2 %).
... as well as food prices.
Food prices increased in both months (+0.8 % following +0.3 % in July). These advances can be traced to the significant rises in meat prices (+3.2 % following +0.9 %) and - to a lesser extent - prices for meat products (+0.1 % following +1.0 %), in a context of sharply higher prices for swine and cattle. Other food prices fell, driven by the price of sugar. (–9.8 %).
Prices for "other manufactured products" rose back, following a decline in July.
In July, the fall in prices for "other manufactured products" was mainly due to a significant decline in prices for chemical products (-2.9 %), driven by - with a delay - oil prices. In August, prices for these same chemical products rose back (+3.4 %), but the overall increase was lessened by lower prices for pharmaceutical products (-1.4 %).
FOREIGN MARKETS: +0,5 % in August, following +0.2 % in July
Producer prices of French industrial products sold on foreign markets increased significantly (+0.5 % following +0.2 % in July), mostly due to the rises in prices for refined petroleum products (+8.9 % following +4.9 %). In August, the rise in prices for chemical products (+1.7 %) was offset by the fall in prices for pharmaceutical products (-1.0 %).
ALL MARKETS: +1.0 % in August following +0.4 % in July
On all markets, producer prices of French industrial products rose by +1.0 % in August. Year-over-year, the rise was +2.2 % for the "total industry", led by refined petroleum products (+17.2 %).
Import prices indices of industrial products : +1.6 % in August following +1.8 % in July
In August, prices for imported industrial products rose significantly again (+1.6 % following +1.8 % in July). These increases were mainly attributable to the buying prices for oil and refined petroleum products. The significant rises in food prices (+1.1 % following +1.4 %) also contributed to these advances.
graphiqueGraphique1_EN – Total Industry price indices
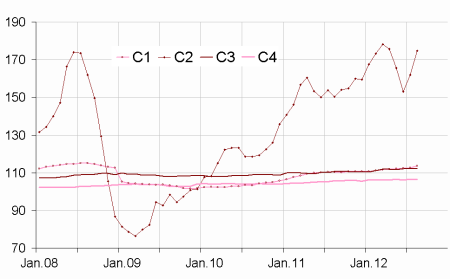
graphiqueGraphique2_EN – Producer price indices of manufactured products sold on the french market
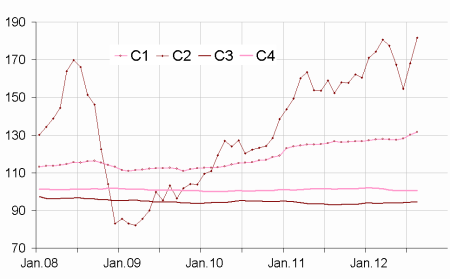
graphiqueGraphique3_EN – Import price indices of manufactured products
tableauTableau1 – French Producer Price Indices in industry according to the market where the products are sold:
| Change in % | |||||
|---|---|---|---|---|---|
| Levels A 10 and A 17 in CPA rev. 2, 2008 | Weight | Aug.12 | Aug / Jul | Jul / Jun | In 1 year |
| French market | |||||
| BE:TOTAL INDUSTRY | 1000 | 118.8 | 1.2 | 0.4 | 2.6 |
| (DE) Mining and quarrying, energy, water | 130 | 134.1 | 1.1 | 0.6 | 3.9 |
| CZ: Manufactured prod. | 870 | 116.5 | 1.3 | 0.4 | 2.4 |
| (C1) Food products, beverages, tobacco | 188 | 113.7 | 0.8 | 0.3 | 2.9 |
| (C2) Coke and refined petroleum products | 70 | 174.6 | 7.8 | 5.8 | 16.1 |
| (C3) Electrical & electronic equip., computers, mach. | 92 | 112.3 | 0.2 | 0.0 | 1.6 |
| (C4) Transport equipment | 79 | 106.5 | 0.1 | 0.1 | 0.7 |
| (C5) Other man. products | 441 | 111.2 | 0.4 | -0.6 | –0.4 |
| Foreign markets | |||||
| BE:TOTAL INDUSTRY | 1000 | 108.6 | 0.5 | 0.2 | 1.4 |
| CZ: Manufactured prod. | s | 108.3 | 0.5 | 0.2 | 1.4 |
| (C1) Food products, beverages, tobacco | 82 | 118.7 | 0.5 | 0.2 | 1.1 |
| (C2) Coke and refined petroleum products | 25 | 242.5 | 8.9 | 4.9 | 22.6 |
| (C3) Electrical & electronic equip., computers, mach. | 202 | 97.1 | 0.1 | 0.1 | 0.0 |
| (C4) Transport equipment | 211 | 101.5 | 0.0 | 0.4 | 1.4 |
| (C5) Other man. products | s | 107.3 | –0.1 | -0.2 | –0.1 |
| All markets | |||||
| BE:TOTAL INDUSTRY | 1000 | 115.6 | 1.0 | 0.4 | 2.2 |
| CZ: Manufactured prod. | s | 113.7 | 1.0 | 0.4 | 2.0 |
| (C1) Food products, beverages, tobacco | 154 | 114.5 | 0.8 | 0.3 | 2.5 |
| (C2) Coke and refined petroleum products | 56 | 184.1 | 8.0 | 5.7 | 17.2 |
| (C3) Electrical & electronic equip., computers, mach. | 127 | 104.6 | 0.1 | 0.1 | 0.9 |
| (C4) Transport equipment | 121 | 103.7 | 0.0 | 0.2 | 1.1 |
| (C5) Other man. products | s | 110.0 | 0.2 | -0.5 | –0.3 |
tableauTableau2 – Import prices of industrial products
| Change en % | |||||
|---|---|---|---|---|---|
| Levels A 10 and A 17 of CPA rev. 2, 2008 | Weight | Aug.12 | Aug / Jul | Jul / Jun | In 1 year |
| BE:TOTAL INDUSTRY | 1000 | 123.0 | 1.6 | 1.8 | 4.0 |
| CZ: Manufactured prod. | s | 111.7 | 0.9 | 0.8 | 2.1 |
| (C1) Food products, beverages, tobacco | 69 | 131.6 | 1.1 | 1.4 | 3.9 |
| (C2) Coke and refined petroleum products | 41 | 181.6 | 8.0 | 8.7 | 19.2 |
| (C3) Electrical & electronic equip., computers, mach. | 210 | 94.4 | –0.1 | 0.3 | 1.5 |
| (C4) Transport equipment | 133 | 100.4 | –0.1 | 0.0 | –0.9 |
| (C5) Other man. products | s | 113.8 | 0.5 | 0.1 | 0.6 |
- r: updated ; nd: non available ; s : confidential
tableauTableau3 – Revision of each index at total industry level
| May 12 / Apr.12 | Jun.12 / May 12 | |
|---|---|---|
| French producer prices in industry sold on: | ||
| - the French market | -0.1(1) | // |
| - the foreign markets | // | // |
| - all markets | –0.1 | // |
| Import prices of industrial products | // | // |
- (1) Reading note: the evolution of the index between Apr.12 and May 12 published last month was equal to -1 %. It is updated to -1,1 %; that is to say a revision of -0,1 %.
Pour en savoir plus
