


 24 September 2015
2015- n° 234In September 2015, the business climate gets better again in the retail trade and
in the trade and repair of motor vehicles Monthly survey of retailing - September 2015
24 September 2015
2015- n° 234In September 2015, the business climate gets better again in the retail trade and
in the trade and repair of motor vehicles Monthly survey of retailing - September 2015
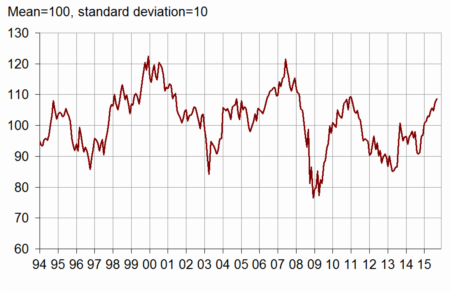
According to the managers surveyed in September 2015, the business climate gets better again in the retail trade and in the trade and repair of motor vehicles. The corresponding synthetic indicator has gone up by two points and stands at 109. It has stayed over its long term average (100) since the beginning of the year.

Warning: the seasonal components have been updated in September, as well as the parameters of the composite indicator, which leads to slight revisions. They are updated once a year.
According to the managers surveyed in September 2015, the business climate gets better again in the retail trade and in the trade and repair of motor vehicles. The corresponding synthetic indicator has gone up by two points and stands at 109. It has stayed over its long term average (100) since the beginning of the year.
graphiquegraph_indsynt_en – Business climate synthetic indicator
Expected sales on the rise
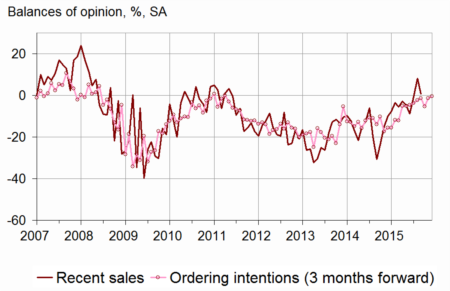
More managers, in retail trade and in trade and repair of motor vehicles, have noted a decline in their past activity: the corresponding balance has dropped but has remained over its long term average. On the other hand, the balance concerning expected sales has increased and has reached its highest point since the beginning of 2008. The balances concerning ordering intentions and general business outlook have risen more slightly.
Stocks have been still estimated lower than normal.
More business leaders than on the last interrogation have declared past falls in prices. Almost as many expect some over the next few months.
The cash position is still estimated moderatly difficult.
graphiqueGraph_ventes_ic_en – Recent sales and ordering intentions
tableautab1_en – Global data
| Ave. (1) | June 15 | July 15 | Aug. 15 | Sept. 15 | |
|---|---|---|---|---|---|
| Business climate | 100 | 106 | 105 | 107 | 109 |
| General business outlook | –30 | –22 | –22 | –19 | –17 |
| Recent sales | –7 | –9 | –1 | 8 | 1 |
| Expected sales | –3 | 0 | 4 | 1 | 10 |
| Ordering intentions | –9 | –1 | –5 | –1 | 0 |
| Stocks | 10 | 9 | 10 | 7 | 7 |
| Past selling prices (2) | –6 | –11 | –17 | ||
| Expected selling prices | –3 | –4 | –6 | –9 | –8 |
| Cash position (2) | –15 | –16 | –17 | ||
| Workforce size: recent trend | 0 | –2 | –1 | –5 | –2 |
| Workforce size: future trend | –3 | –5 | –4 | –7 | –4 |
- (1) Average since 1991 (2004 for recent and expected sales and ordering intentions).
- (2) Bi-monthly question (odd-numbered months).
- Source: monthly survey in the retail trade and in the trade and repair of motor vehicles - INSEE
Employment near its average
Each of both balances concerning recent and future trends on workforce size has slightly increased and is near its average.
Revisions
The business climate of August 2015 has been revised upward by two points since its first estimate last month. This rise is due firstly to seasonal components revisions, secondly to late answers which have been taken into account.
Retail trade
Activity balances above the average in non-specialised trade
In retail trade, the past activity balance is stable. In non-specialised trade, this balance has progressed for three months and is significantly above its long-term average. By contrast, in specialised trade, the balance has fallen back below its average.
The forecasts of non-specialised retailers are more optimistic than these of specialised ones too: each of the two balances concerning non-specialised expected sales and ordering intentions stands significantly above its average. On the contrary, in specialised trade these balances have dropped again below their mean level.
Stocks are estimated stable and under their standard level in both kinds of trade.
Overall, more retailers than on the last interrogation have declared price falls in the past, and as many of them anticipate some over the next few months.
Slightly more non-specialised retailers have indicated their cash position has worsened.
Trade and repair of motor vehicles
Optimistic forecasts
More motor vehicles business leaders than in August have declared a decline in their past sales; however, the corresponding balance remains above its average.
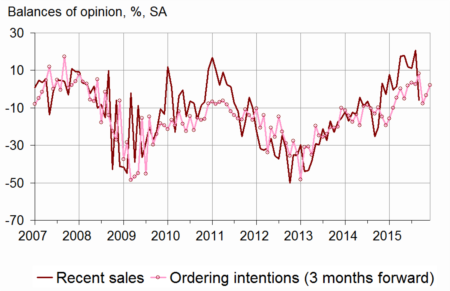
Anticipations are more optimistic: each of the two balances concerning ordering intentions and expected sales has increased, this last one reaching the highest level since the beginning of 2008.
graphiquegraph_ventes_ic_auto_en – Recent sales and ordering intentions in motor vehicles
Stocks, estimated higher, have got nearer their standard level.
The balances on past and expected prices have been roughly stable.
The cash-flow situation is still estimed less deteriorated than the long-term average.
tableautab2_en – Detailed data
| Ave. (1) | June 15 | July 15 | Aug. 15 | Sept. 15 | |
|---|---|---|---|---|---|
| Retail trade - Global data | |||||
| Recent sales | –6 | –17 | –6 | 3 | 3 |
| Expected sales | –1 | –2 | 4 | 3 | 7 |
| Ordering intentions | –7 | –5 | –6 | 0 | –2 |
| Stocks | 10 | 9 | 9 | 6 | 5 |
| Past selling prices (2) | –8 | –15 | –25 | ||
| Expected selling prices | –5 | –7 | –9 | –11 | –11 |
| Cash position (2) | –13 | –16 | –17 | ||
| Workforce size: recent trend | 1 | 0 | 1 | –4 | –2 |
| Workforce size: future trend | –2 | –6 | –4 | –8 | –3 |
| Non-specialised retail trade | |||||
| Recent sales | –2 | –18 | –2 | 10 | 18 |
| Expected sales | 6 | 6 | 13 | 12 | 19 |
| Ordering intentions | 1 | 1 | 2 | 12 | 11 |
| Stocks | 7 | 4 | 4 | 3 | 2 |
| Past selling prices (2) | –9 | –17 | –31 | ||
| Expected selling prices | –5 | –7 | –5 | –9 | –15 |
| Cash position (2) | –7 | –9 | –12 | ||
| Specialised retail trade | |||||
| Recent sales | –11 | –16 | –10 | –5 | –14 |
| Expected sales | –8 | –12 | –5 | –7 | –9 |
| Ordering intentions | –17 | –14 | –13 | –13 | –18 |
| Stocks | 14 | 14 | 16 | 10 | 8 |
| Past selling prices (2) | –8 | –13 | –16 | ||
| Expected selling prices | –5 | –9 | –13 | –14 | –7 |
| Cash position (2) | –22 | –23 | –23 | ||
| Trade and repair of motor cars and motorcycles | |||||
| Recent sales | –10 | 12 | 11 | 21 | –6 |
| Expected sales | –9 | 3 | 0 | –1 | 13 |
| Ordering intentions | –13 | 8 | –8 | –3 | 2 |
| Stocks | 15 | 10 | 12 | 8 | 13 |
| Past selling prices (2) | 1 | –1 | 0 | ||
| Expected selling prices | 4 | 5 | 2 | 0 | 1 |
| Cash position (2) | –25 | –16 | –18 | ||
| Workforce size: recent trend | –9 | –4 | –10 | –6 | –1 |
| Workforce size: future trend | –7 | –1 | –3 | 0 | –4 |
- (1) Average since 1991 (2003 for trade and repair of motor vehicles and 2004 for recent and expected sales and ordering intentions).
- (2) Bi-monthly question (odd-numbered months).
- Source: monthly survey in the retail trade and in the trade and repair of motor vehicles - INSEE
Documentation
Methodology (pdf,129 Ko)
Pour en savoir plus
