


 11 September 2015
2015- n° 220In August 2015, oil prices declined sharply again Prices of oil and raw material imports - A
11 September 2015
2015- n° 220In August 2015, oil prices declined sharply again Prices of oil and raw material imports - A
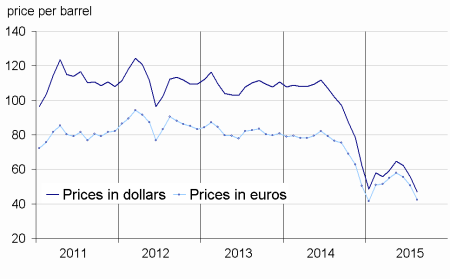
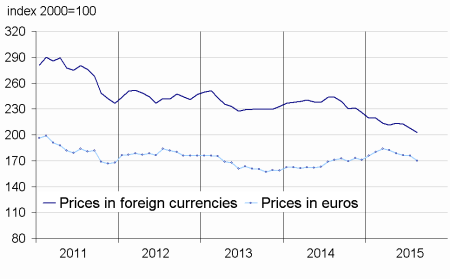
In August 2015, the price of crude oil in euros declined sharply (–16.8% after –8.7% in July), to average 42.2€ per barrel of Brent. The price tumbled by 44.9% compared to its level in August 2014 (76.6€). Prices in euros of imported commodities except energy fell back (–3.4% after +0.6%): this downturn became widespread both in industrial raw materials (–3.3%) and in raw food materials (–3.5%).
In August 2015, the price of crude oil in euros declined sharply (–16.8% after –8.7% in July), to average 42.2€ per barrel of Brent. The price tumbled by 44.9% compared to its level in August 2014 (76.6€). Prices in euros of imported commodities except energy fell back (–3.4% after +0.6%): this downturn became widespread both in industrial raw materials (–3.3%) and in raw food materials (–3.5%).
Oil prices in euros decreased more
As a result of a still high supply in Saudi Arabia and despite a slight decrease in the American production, the price of crude oil from the North Sea (Brent) in euros slumped (–16.8% after –8.7%). It dropped a little less in dollars (–15.9% after –10.4%), as the euro appreciated against the American currency (+1.1%).
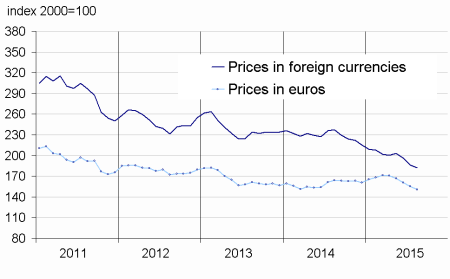
Prices of industrial raw materials kept dropping
Prices of industrial raw materials in euros went down again (–3.3% after –1.7%), mainly due to a drop in agricultural raw materials (–4.7%).
Prices of minerals kept falling at the same rate as in July (–2.8%). In effect, the economic slowdown in China affected prices of non-ferrous metals (–4.0% after –0.9%), in particular those of nickel (–10.4% after –9.2%) and of zinc (–10.7% after -2.2%). Among precious metals, prices of gold kept dipping (–2.2% after –4.6%) along with those of palladium (–2.9% after –7.7%), in connection with a declining Chinese automotive sector. However, prices of iron ore bounced back (+6.3% after –15.7%, –28.5% year-on-year), due to a dropping Chinese output.
Prices of agricultural raw materials edged down (–4.7% after +1.5%). In particular prices of natural rubber plummeted (–16.0% after –8.1%), as a result of a competitive synthetic rubber production that benefited from the drop in oil prices. However, over a year, agricultural raw materials went higher (+2.9%).
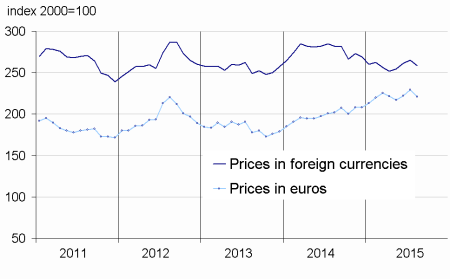
Prices of raw food materials fell back
Prices of raw food materials in euros decreased (–3.5% after +3.3%). Prices of oil seeds and vegetable oils took a downturn (–3.0% after +9.1%), due to a downfall in palm oil prices (–16.8% after –3.2%), prompted by a rise in supply in South-East Asia. The low price level of oil weighed on vegetable oils. Prices of cereals dipped too (–6.8% after +9.4%), in particular those of maize (–10.5% after +13.7%) and of rice (–4.2% after +6.7%). The rice market showed both a high competition on exports and a low demand. Price of sugar tumbled (–11.2% after +3.1%), due to a high supply.
tableautabpetrole – Oil and petroleum products
| Prices | Change (%) | |||
|---|---|---|---|---|
| of last month | over the last month | over the last 3 months | over the last 12 months | |
| Brent in $ per barrel | 47.0 | –15.9 | –27.2 | –53.9 |
| Brent in € per barrel | 42.2 | –16.8 | –27.0 | –44.9 |
| Gasoline €/L | 0.40 | –16.7 | –12.2 | –25.0 |
| Gas Oil | 416.2 | –12.1 | –22.6 | –36.3 |
| Heavy fuel | 226.0 | –19.0 | –31.6 | –49.0 |
| Naphtha | 372.9 | –13.9 | –25.1 | –43.0 |
- Prices are in euros per tonne unless otherwise specified
- Source: INSEE
tableautabmatprem – Imported raw materials (excluding energy) in euros
| Index | Changes (%) | |||
|---|---|---|---|---|
| of last month | over the last month | over the last 3 months | over the last 12 months | |
| Food total | 221.2 | –3.5 | 1.9 | 9.5 |
| Tropical foodstuffs | 215.4 | –5.3 | 2.3 | 13.6 |
| Oil seeds, vegetable oils | 251.6 | –3.0 | 8.2 | 4.0 |
| Cereals | 150.1 | –6.8 | 0.1 | 7.5 |
| Sugar | 107.4 | –11.2 | –15.8 | –19.7 |
| Beef meat | 176.4 | 0.1 | –4.6 | 18.3 |
| Industrial raw materials | 150.4 | –3.3 | –10.0 | –8.4 |
| Agricultural raw materials | 111.5 | –4.7 | –0.4 | 2.9 |
| Natural fibres | 123.4 | –1.8 | –1.0 | 15.9 |
| Natural rubber | 136.8 | –16.0 | –23.3 | –24.6 |
| Hides | 74.1 | –3.8 | –24.9 | –23.3 |
| Wood pulp | 103.2 | –1.7 | –0.5 | 9.0 |
| Tropical wood | 116.8 | –0.9 | 1.1 | 11.6 |
| Sawn softwood | 88.6 | –9.0 | 7.1 | –9.6 |
| Minerals | 171.6 | –2.8 | –13.0 | –11.7 |
| Iron ore | 368.4 | 6.3 | –7.8 | –28.5 |
| Non-ferrous metals | 143.9 | –4.0 | –13.9 | –10.2 |
| Precious metals | 221.6 | –1.5 | –10.3 | –4.2 |
| All commodities | 170.0 | –3.4 | –4.8 | –0.6 |
- Source: INSEE
graphiqueG_petrole_ang – Oil (Brent)
- Source: INSEE
graphiqueG_alim_ang – Food
- Source: INSEE
graphiqueG_ensemble_ang – Imported raw materials (excluding energy)
- Source: INSEE
graphiqueG_indus_ang – Industrial raw materials
- Source: INSEE
Pour en savoir plus
Time series : Raw materials prices
