


 13 August 2015
2015- n° 193Consumer prices diminished by 0.4% in July 2015; they rose by 0.2% year-on-year Consumer price index - final results - July 2015
13 August 2015
2015- n° 193Consumer prices diminished by 0.4% in July 2015; they rose by 0.2% year-on-year Consumer price index - final results - July 2015
The Consumer Price Index (CPI) decreased by 0.4% in July 2015 after –0.1% in June. Seasonally adjusted, it remained stable compared with the previous month and continued to rise slightly year-on-year (+0.2% after +0.3% in June).
Monthly change: –0.4%; Year-on-year: +0.2%
The Consumer Price Index (CPI) decreased by 0.4% in July 2015 after –0.1% in June. Seasonally adjusted, it remained stable compared with the previous month and continued to rise slightly year-on-year (+0.2% after +0.3% in June).
The decline in the CPI in july 2015 was due mainly to seasonal falls in manufactured goods prices linked to summer sales, seasonal decreases in fresh foodstuff prices plus a further price reduction in energy. These decreases were partly offset by a rise in prices of some services during the summer holidays.
Fall in manufactured good prices with summer sales
Due to summer sales, prices of manufactured products decreased broadly by 3.1% in july 2015 (–2.9% in July 2014 and –0.9% year-on-year). As every year, prices of clothing and footwear dropped significantly (–14.4%; –1.6% year-on-year), with average discount rates higher this year than last year. Summer sales contributed also to the decrease in prices of other products, but in a lesser extent. This was the case for travel goods and other carriers of personal effects (–4.7%; +1.7% year-on-year), household textiles (–4.0%; –0.5% year-on-year), furniture and furnishings (–3.9%; –0.1% year-on-year), audio-visual, photographic and information processing equipments (–0.7%; –3.4% year-on-year) and domestic appliances (–1.7%; –1.1% year-on-year). Furthermore, the downward trend in prices of medical products continued (–0.4%; –3.6% year-on-year).
tableauOLE_LINK2 – Detailed figures for various groups
| Items | Weight | Index | Percentage change | |
|---|---|---|---|---|
| 2015 | July 2015 | m-on-m change | y-on-y change | |
| a) All households - France | ||||
| All items (00 E) | 10000 | 127.94 | -0.4 | 0.2 |
| All items SA (00 C) | 10000 | 128.12 | 0.0 | 0.2 |
| Food (4000 E) | 1662 | 131.95 | -0.5 | 0.4 |
| Fresh food (4001 E) | 211 | 141.86 | -4.1 | 4.6 |
| Food excluding fresh products (4002 E) | 1451 | 130.55 | 0.0 | -0.2 |
| Tobacco (4034 E) | 199 | 259.28 | 0.0 | 0.3 |
| MANUFACTURED PRODUCTS (4003 E) | 2584 | 96.9 | -3.1 | -0.9 |
| Clothing and footwear (4004 E) | 437 | 93.86 | -14.4 | -1.6 |
| Medical products (4005 E) | 427 | 75.37 | -0.4 | -3.6 |
| Other manufactured products (4006 E) | 1720 | 103 | -0.9 | -0.1 |
| ENERGY (4007 E) | 815 | 171.43 | -1.2 | -4.0 |
| Petroleum products (4008 E) | 418 | 184.17 | -1.8 | -9.2 |
| SERVICES (4009 E) | 4740 | 139.44 | 1.2 | 1.4 |
| Actual rentals and services for dwellings (4010 E) | 767 | 142.84 | 0.0 | 0.9 |
| Medical services (4011 E) | 568 | 122.78 | -0.2 | 0.1 |
| Transport and communication services (4012 E) | 510 | 101.44 | 3.8 | 2.6 |
| Other services (4013 E) | 2895 | 151 | 1.3 | 1.6 |
| ALL ITEMS EXCLUDING RENTALS AND TOBACCO (5000 E) | 9192 | 125.32 | -0.4 | 0.1 |
| ALL ITEMS EXCLUDING TOBACCO (4018 E) | 9801 | 126.02 | -0.4 | 0.2 |
| b) Manual or clerical worker headed urban households - France | ||||
| ALL ITEMS EXCLUDING TOBACCO (4018 D) | 9714 | 125.86 | -0.4 | 0.2 |
| ALL ITEMS (00 D) | 10000 | 128.67 | -0.4 | 0.2 |
| c) Households that belong to the lowest equivalized disposable income quintile - France | ||||
| ALL ITEMS EXCLUDING TOBACCO (4018 Q) | 9687 | 127.22 | -0.3 | 0.1 |
- Source: INSEE - Consumer Price Indexes
tableauTableau1English – Detailed figures for Core inflation* and HICP**
| Items | Weight | Index | Percentage change | |
|---|---|---|---|---|
| 2015 | July 2015 | m-on-m change | y-on-y change | |
| All items "Core inflation" (4022 S) | 6042 | 123.3 | 0.1 | 0.7 |
| Food excluding fresh products, meat, milk and exotic products (4019 S) | 715 | 124.65 | 0.0 | -0.1 |
| Manufactured products (4020 S) | 2103 | 103.98 | -0.3 | -0.4 |
| Services including actual rentals and services for dwellings (4021 S) | 3224 | 141.59 | 0.3 | 1.5 |
| All items HICP (00 H) | 115.68 | -0.5 | 0.2 | |
- * ISJ: Core inflation indicator excludes public sector prices, the most volatile consumer prices and the tax measures. Seasonally adjusted, this index is calculated for all households in France excluding overseas departments and territories (base 100 1998).
- **HICP: Harmonised Indices of Consumer Prices are inflation figures designed for international comparison of consumer price inflation between Member states of the European Union. This index is calculated for all households in France (base 100 2005).
- Source: INSEE - Consumer Price Indexes
graphiqueGraphique1English – Consumer price index (IPC) and Core inflation (ISJ) – year-on-year changes
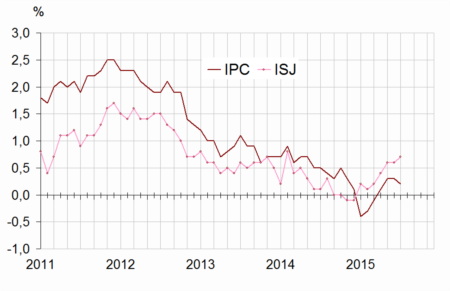
- Source: INSEE - Consumer Price Indexes
Energy prices went down again
Energy prices decreased again in July 2015 (–1.2% after -0.5% in June; –4.0% year-on-year), mainly due to the pursuit of the decline in petroleum product prices (–1.8% after –0.8% in June; –9.2% year-on-year). Prices of motor fuels decreased by 1.5% (–8.0% year-on-year) and those of heating fuels by 4.0% (–16.2% year-on-
year). Town gas prices were also down in July (–1.6%; –2.1% year-on-year) while electricity fares stayed steady (+4.3% year-on-year).
Seasonal decrease in food prices
In July 2015, food prices were down 0.5% compared with the previous month (as in July 2014; +0.4% year-on-year) due to the seasonal decrease in prices of fresh foodstuffs (–4.1%; +4.6% year-on-year), in particular those of fresh fruits (–4.4%; +6.1% year-on-year) and fresh vegetables (–5.3%; +3.9% year-on-year). Excluding unprocessed products, food prices remained stable for the fourth month in a row and declined by 0.2% year-on-year (after –0.3% in June). Prices of milk, cheese and eggs (–2.1%) as well as children foods and dietetic products remained sharply down year-on-year (–7.2%); meat prices were up slightly (+0.5% year-on-year in July after +0.3% in June).
Service prices rose seasonally
As every year, service prices grew significantly in July (+1.2% compared with the previous month; +1.4% year-on-year). The main contributors to this seasonal increase were prices of restaurants, cafes and hotels (+2.2%; +1.4% year-on-year), airfares (+19.8%; +3.1% year-on-year), package holidays (+21.4%; +3.4% year-on-year) and holiday rentals (+24.9%; +0.4% year-on-year). Moreover, fares of insurance connected the dwelling were up (+2.1%; +2.9% year-on-year) after the end of dicounts. Finally, telecommunicaton prices declined slightly in July 2015 (–0.2%; +2.0% year-on-year).
Slight increase in core inflation
The core inflation indicator (ISJ) rose by 0.1% in July 2015 after it remained unchanged in June. Year-on-year, it grew by 0.7% (after +0.6% in May and June). The Harmonized Index of Consumer Prices (HICP) decreased by 0.5% compared with June 2015; it increased by 0.2% year-on-year (down from +0.3% in June 2015).
Pour en savoir plus
