


 30 April 2015
2015- n° 106Despite a downturn in March (-0.6%), household consumption of goods grew sharply
over the first quarter of 2015 (+1.6%) Household consumption expenditure on goods - March 2015
30 April 2015
2015- n° 106Despite a downturn in March (-0.6%), household consumption of goods grew sharply
over the first quarter of 2015 (+1.6%) Household consumption expenditure on goods - March 2015
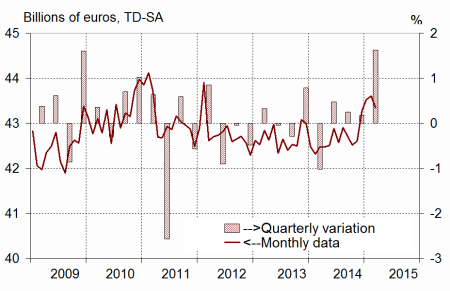
In March 2015, household consumption expenditure on goods stepped back: –0.6% in volume*, after increasing for four months in a row. This decline was mainly attributable to the downturn in energy consumption (–3.2% in March). However, over the first quarter, household expenditure on goods increased markedly (+1.6%), mainly as a result of a substantial rebound in consumption of energy and the acceleration in expenditure on durable goods. This result represents the highest rise since the fourth quarter of 2009.
- Engineered goods : declining slightly in March, increasing markedly over the quarter
- Durables: speeding up over the quarter
- Textile-leather: weakening in March, growing over the quarter
- Other engineered goods: accelerating over the quarter
- Food products: recovering slightly in March, virtually flat over the quarter
- Energy: downturn in March, significant rebound over the quarter
- The variation in March is scaled up by 0.1 point
In March 2015, household consumption expenditure on goods stepped back: –0.6% in volume*, after increasing for four months in a row. This decline was mainly attributable to the downturn in energy consumption (–3.2% in March). However, over the first quarter, household expenditure on goods increased markedly (+1.6%), mainly as a result of a substantial rebound in consumption of energy and the acceleration in expenditure on durable goods. This result represents the highest rise since the fourth quarter of 2009.
Engineered goods : declining slightly in March, increasing markedly over the quarter
Durables: speeding up over the quarter
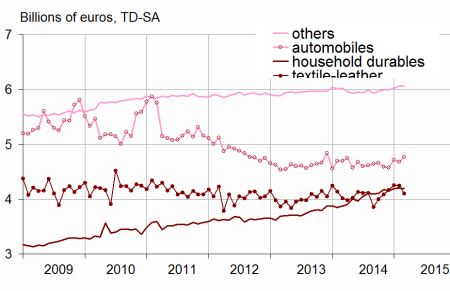
Household expenditure on durable goods went up in March (+1.0%), after holding steady in February. Expenditure on household durables dropped back slightly (–0.2%), after two consecutive months of growth. Conversely, car purchases bounced back (+1.9% after –0.7% in February).
Over the first quarter 2015, expenditure on durable goods sped up significantly (+1.8% after +0.5%), primarily because of car purchases (+2.5% after –0.3%). Expenditure on household durables, for its part, kept rising at almost the same pace as over the previous quarter (+1.3% after +1.5%).
Textile-leather: weakening in March, growing over the quarter
Consumption of textile, clothing and leather decreased in March (–3.3% after –0.2%). In contrast, purchases accelerated over the first quarter (+2.8% after +1.5%).
[* Volumes are chained and all figures are trading days and seasonally adjusted.]
graphiquegraph1_new_ang – Total consumption of goods
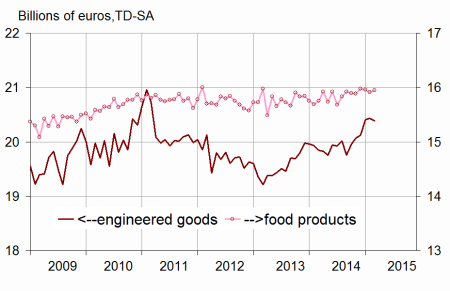
graphiquegraph2_new_ang – Food and engineered goods
graphiquegraph3_new_ang – Breakdown of engineered goods
Other engineered goods: accelerating over the quarter
Consumption expenditure on other engineered goods was practically stable in March (+0.1%, after +0.6%). It sped up over the first quarter (+1.1% after +0.6%).
Food products: recovering slightly in March, virtually flat over the quarter
In March, consumption of food products picked up slightly (+0.2% after –0.3%), especially due to tobacco consumption. Over the first quarter, it was almost stable (+0.1% after +0.7% over the previous quarter).
Energy: downturn in March, significant rebound over the quarter
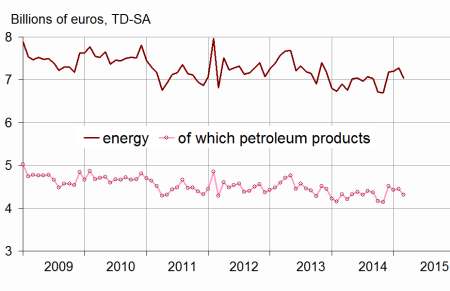
In March, household consumption of energy products eased back (–3.2%), after three consecutive months of increase. Oil, electricity and gas consumption dipped substantially.
Over the first quarter, however, consumption of energy products bounced back sharply (+4.4% after –2.2%).
The variation in March is scaled up by 0.1 point
Household consumption of goods is scaled up by 0.1 point in February, now estimated at +0.2% instead of +0.1% within the previous publication. Conversely, the estimation in January is scaled down by 0.1 point (+0.6%, instead of +0.7% as previously estimated).
These revisions are mainly due to the integration of new information, as well as the updating of the seasonal adjustment coefficients, particularly regarding energy.
graphiquegraph4_new_ang – Energy
tableauenglish_trim – Household consumption expenditure on goods
| Jan. | Feb. | March | March2015/ | Q1 15/ | |
|---|---|---|---|---|---|
| 2015 | 2015 | 2015 | March2014 | Q4 14 | |
| Food products | 15.953 | 15.911 | 15.949 | ||
| Change (%) | –0.1 | –0.3 | 0.2 | 1.2 | 0.1 |
| Engineered goods | 20.402 | 20.431 | 20.391 | ||
| Change (%) | 1.4 | 0.1 | –0.2 | 2.8 | 1.8 |
| Durables | 10.126 | 10.124 | 10.229 | ||
| Change (%) | 1.7 | 0.0 | 1.0 | 4.3 | 1.8 |
| - of which automobiles | 4.714 | 4.681 | 4.768 | ||
| Change (%) | 3.1 | –0.7 | 1.9 | 1.5 | 2.5 |
| - of which household durables | 4.195 | 4.202 | 4.193 | ||
| Change (%) | 1.1 | 0.2 | –0.2 | 8.1 | 1.3 |
| Textile-leather | 4.251 | 4.244 | 4.103 | ||
| Change (%) | 2.0 | –0.2 | –3.3 | 2.2 | 2.8 |
| Other engineered goods | 6.022 | 6.061 | 6.065 | ||
| Change (%) | 0.5 | 0.6 | 0.1 | 0.7 | 1.1 |
| Energy | 7.192 | 7.273 | 7.042 | ||
| Change (%) | 0.1 | 1.1 | –3.2 | 2.0 | 4.4 |
| - including petroleum products | 4.423 | 4.443 | 4.313 | ||
| Change (%) | –2.0 | 0.5 | –2.9 | –0.4 | 2.8 |
| Total | 43.529 | 43.603 | 43.348 | ||
| Change (%) | 0.6 | 0.2 | –0.6 | 2.1 | 1.6 |
| Manufactured goods | 37.256 | 37.265 | 37.184 | ||
| Change (%) | 0.2 | 0.0 | –0.2 | 1.8 | 1.0 |
Documentation
Methodology (pdf,23 Ko)
Pour en savoir plus
