


 15 July 2015
2015- n° 168Consumer prices diminished by 0.1% in June 2015; they increased by 0.3% year-on-year Consumer price index - final results - June 2015
15 July 2015
2015- n° 168Consumer prices diminished by 0.1% in June 2015; they increased by 0.3% year-on-year Consumer price index - final results - June 2015
After increasing two months in a row, the Consumer Price Index (CPI) declined slightly in June 2015 (-0.1%). Year-on-year, it rose by 0.3%, as in May 2015.
Monthly change: -0.1%; Year-on-year: +0.3%
After increasing two months in a row, the Consumer Price Index (CPI) declined slightly in June 2015 (-0.1%). Year-on-year, it rose by 0.3%, as in May 2015.
In June, prices of manufactured products, especially clothing and footwear, decreased seasonally with the start of summer sales. Moreover, prices of petroleum products and food also went down. These decreases were not totally offset by the seasonal increase in prices of some services related to tourism with the upcoming summer season.
Decrease in prices of manufactured products
In June 2015, prices of manufactured products decreased by 0.4% (as in June 204; -0.7% year-on-year) mainly due to the beginning of summer sales. Their impact was especially strong for clothing and footwear (-2.0%; -0.5% year-on-year) as well as for household textiles (-1.6%; +0.6% year-on-year) and for travel goods and other carriers of personal effects (-0.7%; stable compared with June 2014). For the other manufactured products, summer sales had a more moderate effect: prices of furniture and furnishings were sligtly down (-0.1% in june ; +0.3% year-on-year), those of audio-visual, photographic and information processing equipments stayed stable (-4.0% year-on-year after -4.6% in May) while those of household aplliances rose slightly (+0.1%; -1.5% year-on-year). Furthermore, health product prices continued to decline (-0.7%; -3.5% year-on-year). On the contrary, prices of new cars were up (+0.9% in June; +2.1% year-on-year).
tableauOLE_LINK2 – Detailed figures for various groups
| Items | Weight | Index | Percentage change | |
|---|---|---|---|---|
| 2015 | June 2015 | m-on-m change | y-on-y change | |
| a) All households - France | ||||
| All items (00 E) | 10000 | 128.47 | -0.1 | 0.3 |
| All items SA (00 C) | 10000 | 128.18 | -0.1 | 0.3 |
| Food (4000 E) | 1662 | 132.65 | -0.2 | 0.4 |
| Fresh food (4001 E) | 211 | 147.95 | -2.0 | 5.2 |
| Food excluding fresh products (4002 E) | 1451 | 130.52 | 0.0 | -0.3 |
| Tobacco (4034 E) | 199 | 259.28 | 0.0 | 0.3 |
| MANUFACTURED PRODUCTS (4003 E) | 2584 | 99.96 | -0.4 | -0.7 |
| Clothing and footwear (4004 E) | 437 | 109.66 | -2.0 | -0.5 |
| Medical products (4005 E) | 427 | 75.64 | -0.7 | -3.5 |
| Other manufactured products (4006 E) | 1720 | 103.95 | 0.0 | 0.0 |
| ENERGY (4007 E) | 815 | 173.50 | -0.5 | -2.8 |
| Petroleum products (4008 E) | 418 | 187.64 | -0.8 | -7.3 |
| SERVICES (4009 E) | 4740 | 137.82 | 0.2 | 1.3 |
| Actual rentals and services for dwellings (4010 E) | 767 | 142.82 | 0.1 | 1.0 |
| Medical services (4011 E) | 568 | 123.02 | 0.0 | 0.5 |
| Transport and communication services (4012 E) | 510 | 97.75 | 0.7 | 1.5 |
| Other services (4013 E) | 2895 | 149.08 | 0.2 | 1.5 |
| ALL ITEMS EXCLUDING RENTALS AND TOBACCO (5000 E) | 9192 | 125.88 | -0.1 | 0.2 |
| ALL ITEMS EXCLUDING TOBACCO (4018 E) | 9801 | 126.55 | -0.1 | 0.3 |
| b) Manual or clerical worker headed urban households - France | ||||
| ALL ITEMS EXCLUDING TOBACCO (4018 D) | 9714 | 126.32 | -0.1 | 0.3 |
| ALL ITEMS (00 D) | 10000 | 129.13 | -0.1 | 0.3 |
| c) Households that belong to the lowest equivalized disposable income quintile - France | ||||
| ALL ITEMS EXCLUDING TOBACCO (4018 Q) | 9687 | 127.58 | -0.1 | 0.2 |
- Source: INSEE - Consumer Price Indexes
tableauTableau1English – Detailed figures for Core inflation* and HICP**
| Items | Weight | Index | Percentage change | |
|---|---|---|---|---|
| 2015 | June 2015 | m-on-m change | y-on-y change | |
| All items "Core inflation" (4022 S) | 6042 | 123.17 | 0.0 | 0.6 |
| Food excluding fresh products, meat, milk and exotic products (4019 S) | 715 | 124.69 | 0.0 | -0.3 |
| Manufactured products (4020 S) | 2103 | 104.34 | -0.2 | -0.2 |
| Services including actual rentals and services for dwellings (4021 S) | 3224 | 141.17 | 0.1 | 1.4 |
| All items HICP (00 H) | 116.24 | -0.1 | 0.3 | |
- * ISJ : Core inflation indicator excludes public sector prices, the most volatile consumer prices and the tax measures. Seasonally adjusted, this index is calculated for all households in France excluding overseas departments and territories (base 100 1998).
- **HICP : Harmonized Indices of Consumer Prices are inflation figures designed for international comparison of consumer price inflation between Member states of the European Union. This index is calculated for all households in France (base 100 2005).
- Source: INSEE - Consumer Price Indexes
graphiqueGraphique1English – Consumer price index (IPC) and Core inflation (ISJ) – year-on-year changes
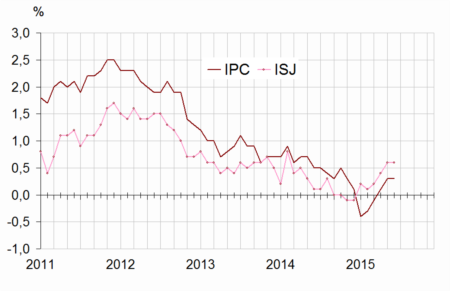
- Source: INSEE - Consumer Price Indexes
Energy prices fell back
In June 2015, energy prices decreased again after four consecutive months of increase (-0.5% compared with may; -2.8% year-on-year). In the wake of declining crude oil prices, petroleum product prices diminished (-0.8% month-on-month; -7.3% year-on-year).
The decline in motor fuels (-0.6%; -6.3% year-on-year) was less marked than for heating fuels (-1.7%; -13.0% year-on-year). Town gas prices were down again, albeit more moderatly (-0.5% month-on-month after -1.1%; -0.8% year-on-year). Those of electricity were stable (+4.3% year-on-year).
Seasonal decrease in food prices
In June 2015, food prices decreased slightly (-0.2%; +0.4% year-on-year) due to the seasonal decline in prices of fresh foodstuffs (-2.0%; +5.2% year-on-year), in particular those of fresh vegetables (-3.5%; +5.3% year-on-year) and fresh fish and seafood (-3.1%; +4.3% year-on-year). However, prices of fresh fruits were virtually stable (-0.1%; +5.5% year-on-year). Excluding unprocessed products, food prices remained overall stable (-0.3% year-on-year).
Service prices rose seasonally
In June 2015, service prices grew again (+0.2% after +0.1% in May) mainly due to seasonal variations with the upcoming summer season. Thus, prices of accomodation services increased significantly (+5.7%; +2.7% year-on-year) as did holiday rentals (+2.4%; +0.9% year-on-year). As well, airfares bounced back in June (+1.5% after -2.8%; -1.9% year-on-year). However, but also in a seasonal manner, prices of package holidays fell largely between spring and summer holidays (-8.2% in June 2015; +0.1% year-on-year). Furthermore, telecommunicaton prices were up (+1.3% in June; +2.2% compared with the same month one year ago). All in all, service prices rose by 1.3% year-on-year, as in May 2015.
Core inflation remained stable
In June 2015, the core inflation indicator (ISJ) was unchanged (after +0.2% in May). Year-on-year, it rose by 0.6%, as in May. The Harmonized Index of Consumer Prices (HICP) was down 0.1% in June 2015; year-on-year, it grew by 0.3%, as during the previous month.
Pour en savoir plus
