


 31 July 2015
2015- n° 188Overall agricultural producer prices increased in June 2015 Indices of agricultural prices - juin 2015
31 July 2015
2015- n° 188Overall agricultural producer prices increased in June 2015 Indices of agricultural prices - juin 2015
In June 2015, agricultural prices went up by 1.6% compared to May; they decreased year on year by 3.4%
In June 2015, agricultural prices went up by 1.6% compared to May; they decreased year on year by 3.4%
Cereals prices rebounded in June (+5.8%). The markets reacted to adverse weather conditions in the US (too wet) and Western Europe (too dry).
graphiquecereal – Producer prices of cereals
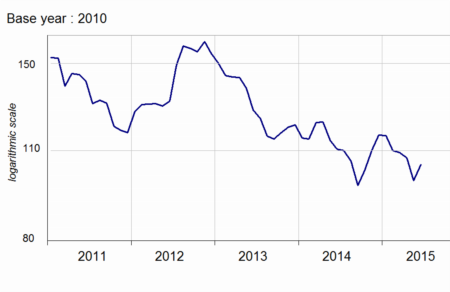
- Source : Insee
Oilseed prices continued to increase in June (+3.6%), taking almost 30% over nine months. Global rapeseed production would decline because of lower yields in Canada and Europe.
The wine prices dipped year on year (-2.5%). The last harvest was good, except in the Languedoc-Roussillon region. Hence, the prices of common wines, massively produced in that place, rose significantly (+13.1% yoy). Conversely, prices of PDO (protected designation of origin) wines decreased (-8.0% yoy).
Prices for fresh fruits increased compared to last year (+10.7%). The strawberry became more expensive. Demand remained strong despite progress in the season and the arrival of summer fruits. Moreover, Spanish imports were more limited this year. Cherry, apricots and peaches prices also jumped, due to the significant decline in their productions in relation with climate hazards, while the hot weather favoured their consumption.
graphiquevegetable – Producer prices of fresh vegetables
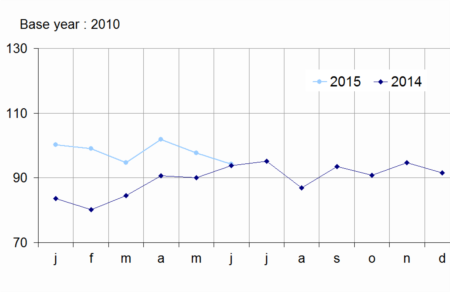
- Source : SSP (ministry of agriculture)
Prices of fresh vegetables were stable (+0.4% yoy). Tomato prices changed little because of a stabilized production. Zucchini became more expensive due to lower supply linked to the declines in greenhouse growing and imports. Conversely, the price of melon decreased, reflecting an abundant production. Greenhouse growing of this vegetable expanded, increasing yields, like the hot and dry weather.
graphiquepig – Producer prices of pigs and large cattle
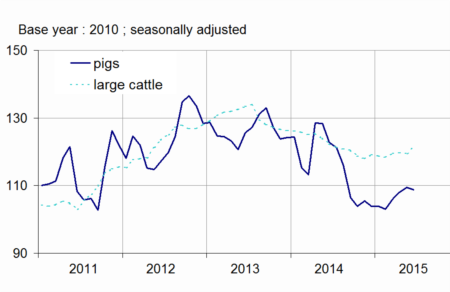
On a seasonally adjusted basis, animals prices were virtually unchanged in June (+0.3%) but decreased significantly year on year (-4.8%). Pork prices tumbled by more than 10 % over this period, due to the Russian embargo and European competition, mainly German. The milk price slumped by 10% year on year, in conjunction with the decline in global demand for dairy products that had been driven by China in 2014.
tableauTab1 – Indices of producer prices of agricultural products (IPPAP)
| Variation as % over | |||||
|---|---|---|---|---|---|
| weights | June 2015 | a month | 3 months | a year | |
| raw | Seasonally adjusted | raw | |||
| Agricultural goods output | 1000 | 112,6 | +1.6 | +0.8 | –3.4 |
| excluding fruits and vegetables | 900 | 113,8 | +1.6 | +1.0 | –4.1 |
| Crop output (excluding fruits and vegetables) | 505 | 115,0 | +2.2 | –0.2 | –2.5 |
| Cereals | 188 | 104,7 | +5.8 | –4.3 | –5.4 |
| of which soft wheat | 112 | 100,2 | +5.3 | –7.7 | –8.8 |
| grain maize | 41 | 94,5 | +6.6 | +1.3 | –6.5 |
| Potatoes | 26 | 103,3 | /// | /// | –7.9 |
| Wines | 177 | 130,7 | +0.2 | +0.8 | –2.5 |
| Protected designation of origin | 84 | 134,5 | –0.7 | +0.3 | –8.0 |
| other wines | 23 | 156,8 | +3.6 | +4.1 | +13.1 |
| Oleaginous | 49 | 106,7 | +3.6 | +6.2 | +12.7 |
| Horticultural products | 30 | 105,5 | +1.0 | +0.5 | +0.2 |
| Other crop products | 36 | 118,8 | +0.2 | –0.7 | –2.2 |
| Fruits and vegetables (1) | 100 | 101,7 | /// | /// | +4.5 |
| Fresh vegetables | 53 | 94,2 | /// | /// | +0.4 |
| Fresh fruits | 35 | 108,0 | /// | /// | +10.7 |
| Animal output | 395 | 112,2 | +0.9 | +2.6 | –6.2 |
| Animals | 234 | 114,2 | +0.3 | +0.2 | –4.8 |
| of which large cattle | 96 | 121,8 | +1.7 | +1.7 | –0.6 |
| calves | 26 | 102,5 | –1.7 | –7.7 | –6.2 |
| pigs | 54 | 111,6 | –0.6 | +2.5 | –11.4 |
| sheep | 10 | 111,1 | –1.7 | –6.1 | –5.2 |
| poultry | 46 | 110,0 | –0.4 | +0.4 | –4.6 |
| of which chicken | 28 | 110,0 | –0.3 | 0.0 | –4.7 |
| Milk | 147 | 107,9 | 0.0 | +6.6 | –10.0 |
| of which cow milk (2) | 137 | 108,4 | 0.0 | +7.1 | –10.7 |
| Eggs | 15 | 124,1 | +20.6 | +4.3 | +9.5 |
- (1) Including vegetables for industry.
- (2)The price for June is not yet known and therefore is estimated by carrying forward the seasonally adjusted price of May
- Sources : Insee - SSP (ministry of agriculture)
The purchase price of means of production decreases in June
In June, prices for intermediate consumption decreased (-0.9%), partly due to lower energy prices (-2.2%) and fertilizers (-3.2%). In one year, prices of energy and feed significantly decreased (resp. -12.1% and -6.4%). Investment prices were almost stable in June (-0.2%).
graphiquemeans – Purchase prices of the means of agricultural production
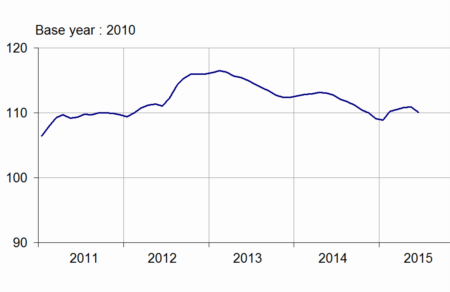
- Sources : Insee and SSP (ministry of agriculture)
tableauTab2 – Indices of purchase prices of the means of agricultural production (IPAMPA)
| weights | June 2015 | Variation as % over | |||
|---|---|---|---|---|---|
| a month | |||||
| Total input | 1000 | 110,1 | –0.7 | –0.4 | –2.4 |
| Intermediate consumptions | 764 | 111,2 | –0.9 | –0.6 | –3.2 |
| Energy | 100 | 103,8 | –2.2 | –0.2 | –12.1 |
| Seeds | 57 | 108,9 | –0.2 | 0.0 | +0.5 |
| Fertilisers and soil improvers | 92 | 117,9 | –3.2 | –3.7 | +1.2 |
| Plant protection products | 78 | 100,9 | –0.2 | +0.5 | –0.3 |
| Animal feed | 205 | 117,6 | –0.5 | –0.8 | –6.4 |
| Veterinary expenses | 43 | 113,4 | 0.0 | +0.3 | +1.8 |
| Small equipment and tools | 17 | 108,5 | +0.4 | +0.6 | –0.2 |
| Maintenance of materials | 67 | 113,0 | –0.1 | +0.2 | +1.5 |
| Maintenance of buildings | 9 | 106,8 | 0.0 | +0.1 | –0.2 |
| Other goods and services | 97 | 101,6 | 0.0 | +0.1 | –0.5 |
| Goods and services contributing to investment | 236 | 106,8 | –0.2 | +0.4 | +0.4 |
| Material | 186 | 107,3 | –0.2 | +0.6 | +0.7 |
| Tractors | 79 | 107,0 | –0.3 | +1.1 | +0.9 |
| Machinery and plant for cultivation | 36 | 109,0 | –0.2 | +0.1 | +0.7 |
| Machinery and plant for harvesting | 42 | 107,6 | –0.2 | +0.5 | +0.6 |
| Utility vehicles | 18 | 104,8 | –0.3 | –0.1 | 0.0 |
| Buildings | 50 | 104,8 | 0.0 | 0.0 | –0.5 |
- (1) The repayment of the domestic tax on energy products (TICPE) benefiting farmers has been applied in advance for the year 2015
- Sources: Insee - SSP (ministry of agriculture)
Documentation
Methodology (pdf,122 Ko)
Pour en savoir plus
Time series : Indices of agricultural prices
