


 17 July 2015
2015- n° 173Rebound in business start-ups in June 2015 Enterprise births - June 2015
17 July 2015
2015- n° 173Rebound in business start-ups in June 2015 Enterprise births - June 2015
In June 2015, after having diminished for two months in a row, the number of business births rose again (+3.2% for all entreprises, seasonally and working-day adjusted). This rise was due to a rebound in self-managed micro-entrepreneurs’ registrations. Excluding self-managed micro-entrepreneurs, the increase in number of business start-ups was more moderated (+1.9%).
In June 2015, after having diminished for two months in a row, the number of business births rose again (+3.2% for all entreprises, seasonally and working-day adjusted). This rise was due to a rebound in self-managed micro-entrepreneurs’ registrations. Excluding self-managed micro-entrepreneurs, the increase in number of business start-ups was more moderated (+1.9%).
-4.5% year-on-year (quarterly basis)
The raw amount of births added up in the last quarter went down compared to the same quarter one year before (–4.5% for all enterprises and -22.1% for self-managed micro-entrepreneurs alone). The sectors that most contributed1 to that decrease were construction and retail.
-0.9% year-on-year (twelve months basis)
During the last twelve months, the raw number of business start-ups decreased (-0.9% year-on-year). The drop in sole proprietorships births (-2.7%) was partly balanced by the rise in companies set-ups (+3.1%).
Nearly half of business set-ups are self–managed micro-entrepreneurs
In June 2015, 47.6% of business set-ups over the last twelve months were micro–entrepreneurs’ registrations.
tableautab0EN – Business set-ups distribution by type
| April 2015 | May 2015 | June 2015 | |
|---|---|---|---|
| Companies | 30,7 | 30,9 | 31,2 |
| Sole proprietorships excluding self-managed micro-entrepreneurs | 20,1 | 20,6 | 21,2 |
| Self-managed micro-entrepreneurs | 49,2 | 48,5 | 47,6 |
- Source: INSEE (Sirene)

1 The contribution of a sector to the overall variation is the observed variation of this sector, weighted by the share of this sector in the total number of births.
graphiqueGraph1EN – Business start-ups (sa-wda *)

- * Seasonally and working-day adjusted data
- Source: INSEE (Sirene)
graphiqueGraph2EN – Trade and business support activities start-ups (sa-wda *)

- * Seasonally and working-day adjusted data
- Source : Insee, Sirene
graphiqueGraph3EN – Construction and real estate business start-ups (sa-wda *)
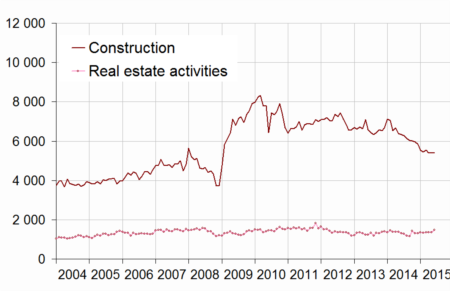
- * Seasonally and working-day adjusted data
- Source : Insee, Sirene
tableautab1EN – Business set-ups by month (sa-wda *)
| March 2015 | April 2015 | May 2015 | June 2015 | |
|---|---|---|---|---|
| Excl. self-managed micro-entrepreneurs | 24,356 | 24,730 | 24,968 | 25,449 |
| Variation [m-o-m] % | 1.1 | 1.5 | 1.0 | 1.9 |
| Incl. self-managed micro-entrepreneurs | 44,158 | 43,680 | 43,003 | 44,362 |
| Variation [m-o-m] % | 1.1 | -1.1 | -1.5 | 3.2 |
- * Seasonally and working-day adjusted data
- Source: INSEE (Sirene)
tableautab2EN – Business start-ups by type
| Moving total % change * | Moving total | Moving total | ||
|---|---|---|---|---|
| over 3 months | over 12 months | January- June 2015 | January- June 2014 | |
| Total | -4.5 | -0.9 | 271,700 | 285,316 |
| Companies | 4.0 | 3.1 | 87,535 | 85,881 |
| Sole proprietorships | -8.2 | -2.7 | 184,165 | 199,435 |
| Of which self-managed micro-entrepreneurs | -22.1 | -7.1 | 116,859 | 144,437 |
- * Total of business start-ups during the last 3 or 12 months compared with the same months a year earlier
- Source: INSEE (Sirene)
tableautab3EN – Number of business set-ups (incl. self-managed micro-enterprises)
| NA | April 2015 | May 2015 | June 2015 | |
|---|---|---|---|---|
| Total | 43,680 | 43,003 | 44,362 | |
| Industry | BE | 2,071 | 2,009 | 1,999 |
| Of which Manufacturing | C | 1,781 | 1,740 | 1,749 |
| Construction | FZ | 5,408 | 5,415 | 5,398 |
| Wholesale and retail trade, Transport, Accommodation and Food and beverage activities | GI | 12,204 | 12,122 | 12,377 |
| Of which Trade | G | 8,130 | 8,219 | 8,337 |
| Of which Transportation and storage | H | 1,715 | 1,359 | 1,609 |
| Of which Accommodation and food service activities | I | 2,356 | 2,323 | 2,362 |
| Information and communication | JZ | 2,203 | 2,102 | 2,148 |
| Financial and insurance activities | KZ | 1,317 | 1,319 | 1,324 |
| Real estate activities | LZ | 1,343 | 1,352 | 1,474 |
| Business support activities | MN | 9,517 | 9,151 | 9,694 |
| Public administration and defence, education, human health and social work activities | OQ | 5,436 | 5,279 | 5,615 |
| Other services activities | RS | 4,181 | 4,253 | 4,333 |
- * Seasonally and working-day adjusted data
- Source: INSEE, Sirene
tableautab3bisEN – Fluctuation in the number of business set-ups (incl. self-managed micro-entrepreneurs)
| NA | June 15 / May 15 | Moving total % change** | ||
|---|---|---|---|---|
| sa-wda * | over 3 months | over 12 months | ||
| Total | 3.2 | -4.5 | -0.9 | |
| Industry | BE | -0.5 | -13.9 | -6.7 |
| Of which Manufacturing | C | 0.5 | -16.9 | -6.4 |
| Construction | FZ | -0.3 | -17.1 | -12.8 |
| Wholesale and retail trade, Transport, Accommodation and Food and beverage activities | GI | 2.1 | -2.6 | 0.6 |
| Of which Trade | G | 1.4 | -7.8 | -5.3 |
| Of which Transportation and storage | H | 18.3 | 49.5 | 45.3 |
| Of which Accommodation and food service activities | I | 1.7 | -4.3 | 4.2 |
| Information and communication | JZ | 2.2 | -2.1 | 1.0 |
| Financial and insurance activities | KZ | 0.4 | 16.4 | 13.2 |
| Real estate activities | LZ | 9.0 | 4.3 | -1.8 |
| Business support activities | MN | 5.9 | -2.9 | 1.4 |
| Public administration and defence, education, human health and social work activities | OQ | 6.4 | 4.3 | 7.4 |
| Other services activities | RS | 1.9 | -6.7 | -3.6 |
- * Seasonally and working-day adjusted data
- ** Total of business start-ups during the last 3 or 12 months compared with the same months a year earlier
- Source: INSEE, Sirene
Pour en savoir plus
Time series : Business demography
